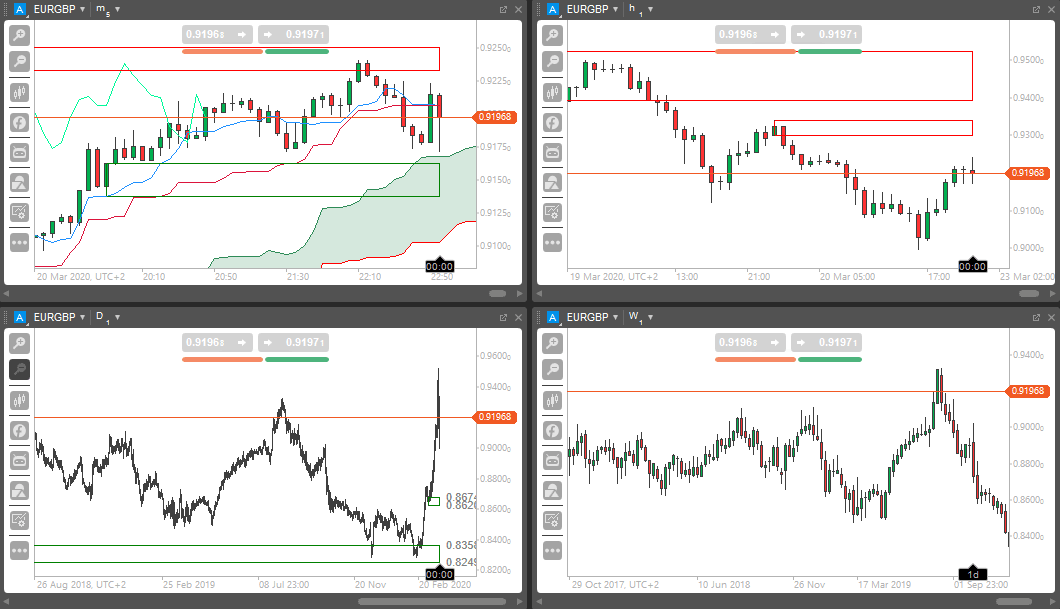
A feature that is often overlooked in the cTrader platform is the ability to link charts together that have the same symbol and apply all the indicators to any other symbol, this is the perfect tool to help you identify trade setups over multiple timeframes.
On each chart that is visible, you will see a small icon on the left-hand side of the symbol name, if you click your mouse on this icon you will see 9 options as shown below, the white box with a diagonal line will unlink the chart, to link the charts together you select the same icon letter for all of them.

The image below shows the EURGBP in 4 charts as a multi-view, if you look left of the symbol name you will see the blue icon with the letter A, this means that if you were to change the symbol on one chart, then all the other charts will also change and they will keep the same indicator setup.

The Active Symbol Panel that is shown on the right of the screen can also be used to control the linked charts, from here you can change the symbol as well as execute orders.
Video Tutorial
This is part 11. of the video series tutorials, it is easier to explain this feature by watching the video tutorial as it will show you it's full potential to help your trading to identify trade setups.
* Video length: 5-minutes
Complete cTrader Video Tutorials
If you are fairly new to the cTrader platform we have an online user guide and hands-on video tutorials to help you.


