cTrader Harmonic Pattern Trading Academy
Welcome to the cTrader Harmonic Pattern Trading Academy based on teachings from Scott M. Carney.

An advanced trading method like harmonic trading uses pure price action which has a determined system for price pattern recognition and Fibonacci techniques which cover the Harmonic Trading approach. Scott is the author of a few excellent books on the subject.
Buy a Book Online
- Harmonic trading in the financial markets - vol 1
- Harmonic trading in the financial markets - vol 2
- View a free online book
Many other books have been written about the subject and one such book was written by Casey Stubbs and his team called The Ultimate Harmonic Pattern Strategy Book: The most accurate harmonic patterns and how to trade them which was published in 2018.
What Is The Definition of a Harmonic
A harmonic is any member of the harmonic series. The term is employed in various disciplines, including music, physics, acoustics, electronic power transmission, radio technology, and other fields. It is typically applied to repeating signals, such as sinusoidal waves. Harmonic trading combines patterns and math into a trading method that is precise and based on the premise that patterns repeat themselves. At the root of the methodology is the primary ratio, or some derivative of it (0.618 or 1.618).
Harmonic trading relies on Fibonacci numbers starting with zero and one which is created by adding the previous two numbers together like the following 0, 1, 1, 2, 3, 5, 8, 13, 21, 34, 55, 89, 144, etc. and this sequence is broken down into ratios that some feel can provide clues as to where the markets will move.
- What are Fibonacci numbers?
- Fibonacci Numbers & Lines Explained
- How to Use the Fibonacci Retracement Tool
- How to use the Fibonacci Expansion Tool
How Harmonic Patterns Are Used In The Financial Markets
The beginning of harmonic patterns started with the Gartley pattern and the Gartley 222 pattern is named because it can be found in one of his books called Profits in the Stock Market under page 222.
- Harmonic Gartley pattern
- Harmonic Butterfly pattern
- Harmonic Bat pattern
- Harmonic Cypher pattern
- Harmonic Crab pattern
- Harmonic Shark pattern
Over time the popularity of the Gartley pattern caused other traders have come up with their own variations of the harmonic pattern collection and the most adopted techniques were from Scott M Carney. This idea assumes that trading the patterns, like many other patterns in life repeat themselves time and time again.
The most fundamental component of natural phenomena is the principle of cycles and a cycle is a frequently occurring sequence of events. You will find that cycles exist in nature, economy, and biology. Cycles in nature include the day/night cycle, the four seasons, and solar activity. The basic business cycle encompasses an economic downturn, bottom, economic upturn, and top. Cycles are also part of the human body in the circadian rhythm, menstrual cycle, and brain waves. The harmonic model (HM) of synchronicity gives those cycles much power and importance and is an alternative approach to computing secondary time intervals.
The purpose of using the Harmonic Pattern is to Identify Trend Reversals
If you are looking to trade in the direction of the market then Harmonic patterns will not be the type of tool you should be using. Harmonic patterns are used as the basis for contrarian positions and are usually seen during periods of high market price volatility and if you are a contrarian trader that looks for opportunities to buy when the price is low or sell when the price is high then harmonic patterns can be an incredible addition to your trading arsenal.
Harmonics is the process of identifying the market's rhythm or its pulse, and then exploiting its trading opportunities. They provide us with visual occurrences that have tendencies to repeat themselves over and over again.

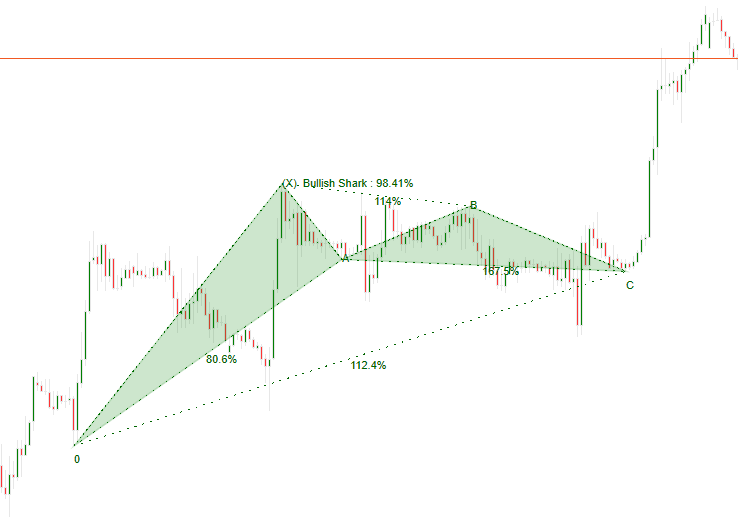
The pattern above was created using the cTrader Harmonic Pattern Scanner Indicator and shows a perfect bullish trend on the pattern formation at C.
Types of Harmonic Patterns
There are various different types of harmonic patterns for all market conditions and instruments, we will cover the 6 most important ones, the ratios used by all patterns can be distinguished between the following. The most popular harmonic patterns that are used by technical traders are the Bat, Gartley and Crab.
What is a Harmonic Pattern PRZ
The Harmonic patterns are determined by distinct price structures and quantified by the Fibonacci calculations and these patterns embody price structures that contain combinations of clear and consecutive Fibonacci retracements and projections, we can use this to identify price reversals in the markets. Scott M. Carney has identified those reversal spots and called them PRZ or The Potential Reversal Zone and a well-defined pattern usually shows an initial reaction with most harmonic patterns.

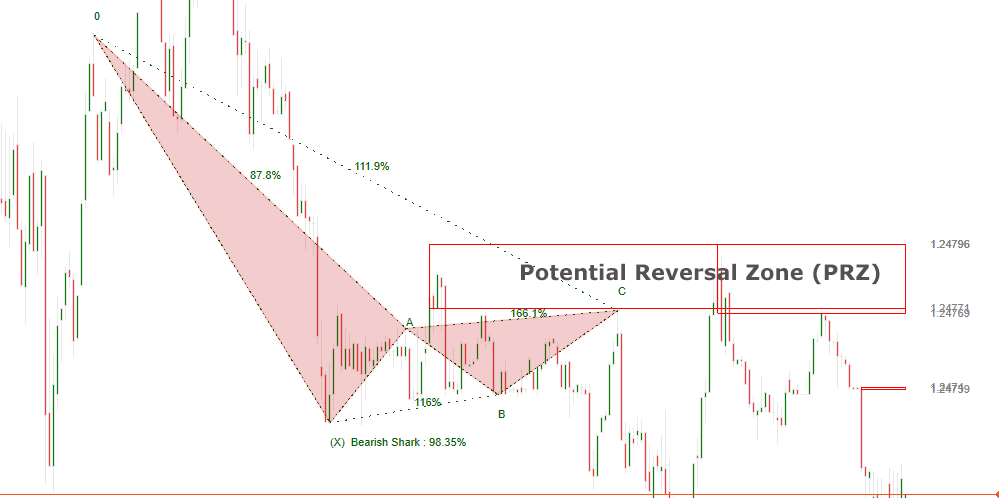
The Bearish Shark Pattern created by the Harmonic Indicator shows a strong resistance level for the Potential Reversal Zone (PRZ), the support and resistance zones are dynamically created on the chart using the cTrader Support & Resistance Zones Indicator.
Hot-Tips When Trading Harmonic Patterns
If you are using our cTrader Harmonic indicator favour the higher accuracy patterns of 99% and above, also, experiment with lower accuracy patterns as these sometimes give good results.
1. Favour Harmonic Patterns with Longer Timeframes
Lower timeframes are not as reliable, it is better to stick to higher timeframes of 1 hr. and above.
2. Preparation
Identify trades that are approaching the Potential Reversal Zone (PRZ) levels, you can use our cTrader support & resistance indicator that will automatically send you an alert when this happens.
3. Pending Orders are your Friend
Professional day-traders are always using pending orders, start using them for your trade setups.
4. Historical Results Using The Harmonic Indicator
Monitor your successful trades using the tool, find the settings for each instrument that provides a consistent outcome.
5. Stick to Your Trading Plan
Have a well-defined plan before you start trading, then follow that plan, as the architect does in building a house, or the engineer in constructing a bridge or driving a tunnel. The man who changes his ideas or his plan, which are based on something practical, for no other reason than that he hopes or fears the market will do something different, will never make a success.
6. Don't Over-Trade
The most important thing when trading is to stay alive. If you stay alive and you have the talent, the money will flow in the long run. When you overtrade in a position you increase the overall market risk of your portfolio and that means bad news in the long run.
Trade Using Our Charting Tools
Using the cTrader Harmonic Pattern Scanner together with the Support & resistance indicator and the Risk & Reward Tool will give you the best combination to trade effectively.


