Indicator Overview
This indicator is designed to make Fibonacci projection trading simple, consistent, and visually clear. It analyses price action to identify swing turning points, then builds forward targets only when price confirms continuation beyond the prior swing level. The result is a set of projected price levels that can serve as structured objectives for trend-continuation moves. Projections are drawn directly on the chart as a Fibonacci expansion and horizontal target lines, with separate colours for bullish and bearish scenarios. You can control sensitivity with fractal depth, how far the projections extend with projection length, and keep the chart clean by limiting the number of recent patterns visible.
i
Live only projections, clean chart output, automatic Fibonacci expansion plus labelled targets, bullish and bearish logic, adjustable sensitivity, adjustable projection length, and an automatic limit that keeps only the last patterns, so the chart stays readable.
Background & History
Fibonacci projections, sometimes called Fibonacci extensions, have long been used to estimate where a continuation move may reach after a pullback and reversal. The approach is based on measuring the distance between two swing points and projecting it forward using common Fibonacci ratios. Many traders use these ratios because they provide consistent reference points for exits and risk management, even when the market is trending strongly and classic support and resistance levels are less obvious. CISD-style projections focus on waiting for clear confirmation that the price has resumed direction, then mapping targets from the confirmed swing structure. This indicator automates the workflow, ensuring projections are created consistently and without manual drawing.
How the Indicator Works
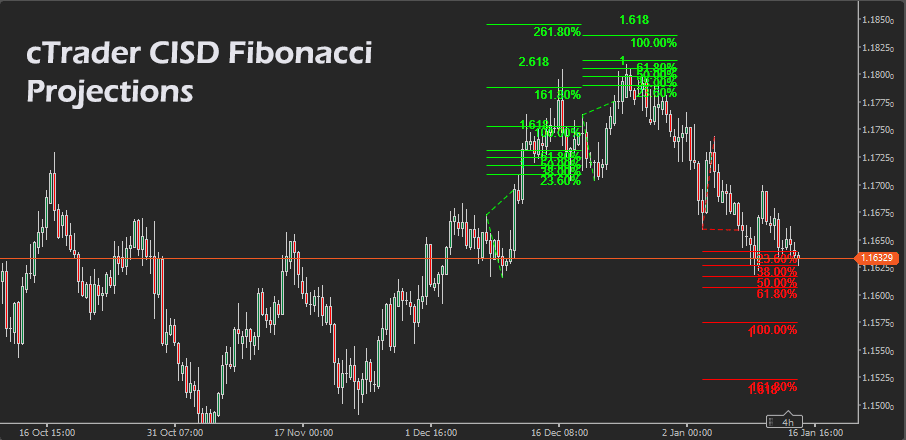
The indicator analyses candlestick highs and lows to detect swing highs and swing lows using a fractal method. A swing is confirmed when the centre bar is higher or lower than surrounding bars within the selected fractal depth. Once two alternating swings are available, it waits for continuation confirmation before drawing projections. For bullish setups, it requires a swing high, a swing low, and a close above the prior swing high. A bearish setup requires a swing low, a swing high, and a close below the prior swing low. When triggered, it draws a Fibonacci expansion and three forward target levels.
-
Select a fractal depth; higher values mean fewer, stronger swings.
-
Wait for alternating swings to form, high to low, or low to high.
-
A bullish projection triggers on a close above the prior swing high.
-
A bearish projection triggers on a close below the prior swing low.
-
Targets are plotted at 1.0, 1.618, and 2.618 times the swing size.
-
Older patterns are removed automatically when the pattern limit is exceeded.
Key Features
The indicator provides straightforward continuation targets with minimal settings and stable behaviour, designed for practical chart use rather than constant redrawing.
-
Detects swing highs and swing lows using fractal depth filtering.
-
Creates bullish and bearish projections only after confirmation by close.
-
Draws Fibonacci expansion plus three labelled target lines.
-
Project levels forward for a configurable number of bars.
-
Limits visible patterns to keep the chart clean and readable.
How to Use it for Trading
Traders can use the plotted targets as objective exit zones and as context for trade planning once continuation is confirmed. A bullish projection suggests the price has broken above the previous swing high after forming a swing low, which often aligns with trend continuation. A bearish projection suggests the price has broken below the previous swing low after forming a swing high, which often aligns with downward continuation. Conservative traders can use the first target as an initial take profit, then manage the remainder toward higher targets using trailing stops or structure-based stops. For risk management, stops are commonly placed beyond the recent swing point that invalidates the continuation, rather than guessing. Beginners should start by trading only in the direction of the higher-timeframe trend and taking partial profits at the first target before attempting extended moves.
-
Identify the market bias with a trend filter, such as a moving average slope.
-
Wait for a new projection to print; do not anticipate the break.
-
For bullish, consider entries on pullbacks after the projection triggers.
-
For bearish, consider entries on rallies after the projection triggers.
-
Use target 1.0 for partial profit, then manage toward 1.618 and 2.618.
-
Place invalidation beyond the most recent swing point, size risk per trade.
Complimentary Indicators
Use confirmation indicators to filter low-quality breaks, align with the trend, and improve risk control around the projected targets.
-
Exponential Moving Average, trend direction and dynamic support and resistance.
-
Average True Range, volatility-based stops and realistic target expectations.
-
Average Directional Movement Index Rating: trend-strength filtering.
-
Relative Strength Index, momentum confirmation and divergence context.
-
Donchian Channel, breakout structure and consolidation framing.
-
Volume-based tools, if available, to confirm participation on the break.
Inputs & Parameters
Use these inputs to control swing sensitivity, projection distance, chart cleanliness, and colour coding. Higher fractal depth reduces noise and produces fewer signals, projection length controls how far the target lines extend, and show last patterns limits how many projections remain on the chart.
| Parameter |
Default/Type |
Description |
| Fractal Depth |
2, int |
The number of bars on each side used to confirm a swing high or swing low; higher values reduce noise and signals. |
| Projection Length (bars) |
80, int |
How many bars into the future the target lines are drawn, longer values extend targets further right on the chart. |
| Show Last X Patterns |
3, int |
The maximum number of most recent projections is kept on the chart; older projections are removed automatically. |
| Bullish Color |
Lime, Colour |
Line and label colour used for bullish projections and targets. |
| Bearish Color |
Red, Colour |
Line and label colour used for bearish projections and targets. |
Formula Explanation
The projection targets are calculated from the swing size between the last two alternating swing points. The indicator measures the absolute distance between swing A and swing B, then projects that distance from swing A using fixed Fibonacci ratios. Bullish targets are added above swing A, bearish targets are subtracted below swing A.
Definitions
A = prior swing price.
B = most recent opposite swing price.
Size = |A − B|.
Level ∈ {1.0, 1.618, 2.618}.
Targets
Bullish Target(Level) = A + Size × Level.
Bearish Target(Level) = A − Size × Level.
Confirmation rules
Bullish trigger, A is a swing high, B is a swing low, Close(reversal) > A.
Bearish trigger, A is a swing low, B is a swing high, Close(reversal) < A.
Advantages
It produces consistent targets without manual drawing, and avoids constant repainting by creating projections only when continuation is confirmed. The chart output is clean, with labelled levels that support structured take profit planning. Sensitivity and clutter are easy to control with a small set of inputs, making it suitable for both fast scanning and detailed planning. The automatic limit on patterns helps maintain readability during active markets.
Disadvantages
Like all swing based tools, results depend on how swings are defined, and different fractal depth settings can materially change signal frequency and target placement. In ranging markets, breaks can fail, which means projections may appear and then price may not reach the targets. Because it waits for confirmation, it can trigger later than aggressive entry methods, so traders who prefer early entries may need a separate entry technique.
How To Install & Remove
First, ensure the cTrader trading platform is installed. Then unzip the file and double-click it to install automatically.
Need Extra Help?
Get instant answers with cTrader Sensei — our free AI assistant built for the cTrader platform. It can explain the indicator settings, suggest trading strategies, and guide you step by step in using the indicator. Rated 4.9 out of 5 in the ChatGPT Store.
Chat with cTrader Sensei
Prefer human help? Visit our support forum where our team and community can assist you.


