cTrader Harmonic Crab Pattern
Harmonic patterns use technical analysis on all symbols including forex, futures, and stocks, it uses certain price patterns which are subject to alignment of precise Fibonacci extension and retracement levels. The Harmonic Crab pattern was discovered in 2001 and as with all harmonic patterns, it is a reversal pattern.
The cTrader Crab pattern belongs to the family of harmonics and it is a very extreme pattern which means that the price action will usually be very volatile as it enters into the Potential Reversal Zone (PRZ). The Crab pattern is a unique harmonic pattern where it's price structure looks the same as the Butterfly chart pattern, but the difference between the Crab pattern and the Butterfly pattern is the CD leg swing that has a larger extension.

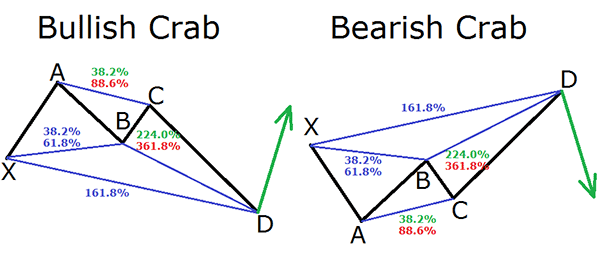
Above we show both a Bullish & Bearish Crab pattern and while most of the swing points remain the same it is point D which is the main differentiating factor that sets apart the Harmonic Crab pattern from the rest of the harmonic patterns.
Crab Pattern Characteristics:
- AB leg can retrace anywhere between 38.2% and up to 61.8%
- BC leg can retrace 38.2% – 88.6% of the AB leg
- CD leg is an extension of up to 161.8% of the XA leg and is also an extension of 224% – 316% of the AB leg
- Once the crab pattern is formed, traders can take their positions at or from point D targeting 61.8% and 127.2% of the CD leg.
- The crab pattern when formed can be very volatile.
- It is good to use oscillators to confirm the momentum especially when the price is trading the PRZ swing point D.
How To Trade The Crab Pattern
Once the Crab pattern has formed and follows the characteristics outlined above, a position can be taken after the CD leg has formed, sometimes you will not find the CD leg to reverse near the 161.8% extension, but if price action begins to stall and a reversal begins to happen, it can be a very high probability setup.
- It is best to wait until the pattern is formed at point D and then to take an appropriate short or long position.
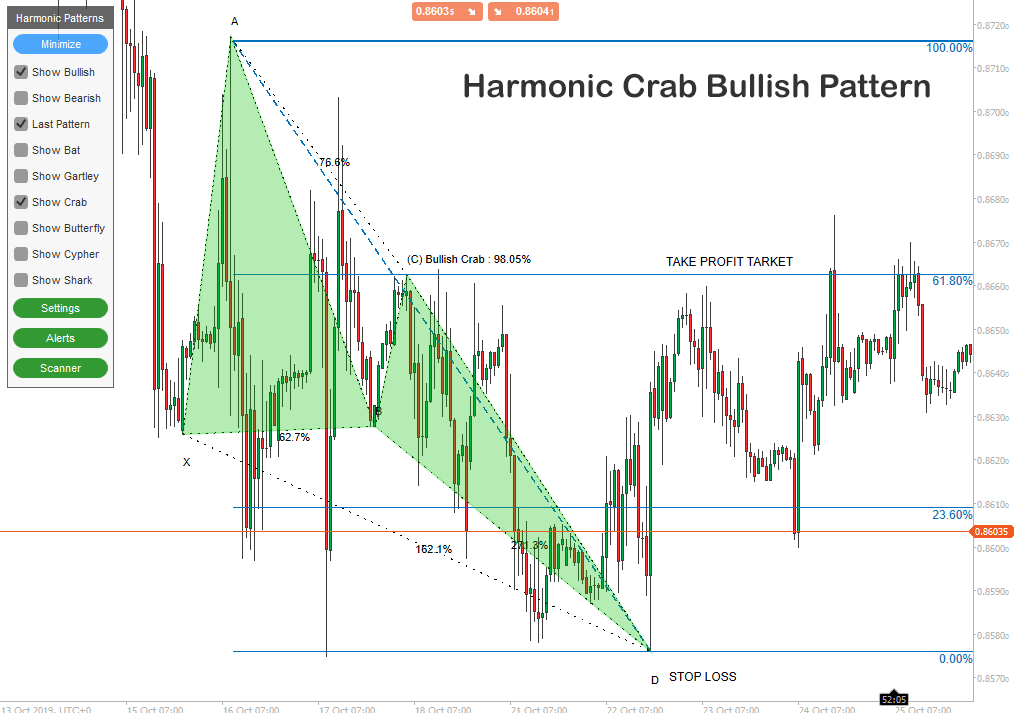
- Stop losses should be placed at the low or the high of Pont D, and targets are usually at points A or B in the pattern.
- A good take profit would be at the 61.8% retracement also known as the golden ratio in Fibonacci Numbers.
Example Trade Setup
The Crab pattern shown in the chart below was created by the cTrader Harmonic Pattern Recognition Software which automatically scans the markets for these type of patterns, also we used the Fibonacci Retracement Tool to identify the take profit targets in the Potential Reversal Zone (PRZ).

Harmonic Pattern Trading
An advanced trading method like harmonic trading uses pure price action which has a determined system for price pattern recognition and Fibonacci techniques which cover the Harmonic Trading approach.


