Search
GBP
Trading Software
    Menu Close

    cTrader K-Means ML Indicator


    14-Day Refund Option (Read Policy)

    Discover trading excellence with our advanced cTrader indicator, powered by machine learning, a true revolution in financial market analysis! This algorithm, more than just a complement, is a key tool for gaining a significant advantage in trading.
    (OS) Type: Windows & Mac OS Compatible
    Current version: 1.1.0 - NET 6
    Updated: Tuesday, 27 February 2024
    Author: Finwalt Trading

    Need a broker?  Open a demo account

    Educational content: Read our disclaimer

    £29.99 Incl. VAT.
    cTrader Software

    Lifetime license, 1-year free updates

    Read our licensing terms


    Innovation Through Machine Learning

    At the core of our system lies machine learning, a technology that allows the algorithm to analyze and learn from historical and current market patterns. This process results in highly accurate and timely predictions, providing traders with critical insights for strategic and well-informed decisions. 


    Machine learning indicators are still in their infancy, they are not mature enough to be highly accurate in the financial markets.

    cTrader A.I Machine Learning


    Deep and Comprehensive Data Analysis

    Using key data from technical indicators such as RSI, ADX, and ATR, the system performs a thorough analysis of market trends and movements. This meticulous analysis provides an in-depth understanding of market dynamics, enabling the development of more effective and data-based trading strategies.


    Advanced Visualization and Real-Time Alerts

    The system is endowed with a superior capacity to visualize data and trends, highlighting essential trading signals directly on your chart. This feature is vital for quickly identifying trading opportunities and facilitating agile decisions based on reliable information.


    Dynamic Adaptation and Continuous Learning

    Benefiting from machine learning, the system constantly adapts and evolves in response to market changes. This ability to learn and continuously improve ensures that the system remains effective and relevant, regardless of market variations.


    Enhanced Security and Guaranteed Reliability

    We incorporate rigorous security measures and a robust license validation process, ensuring that only authorized users have access to the system's advanced functions. This approach guarantees a safe and highly reliable trading environment.


    Custom Optimization for Various Trading Scenarios

    The system is exceptionally versatile, efficiently handling two, three, or more data sets (clusters). Its design allows for extensive customization, adapting to the specific needs and preferences of each trader. In conclusion, this system represents a comprehensive solution for traders looking to capitalize on the power of machine learning to enhance their market performance. With this system, you are equipped to navigate the complex world of trading with greater security and effectiveness. Transform your trading approach with our cutting-edge machine-learning technology!


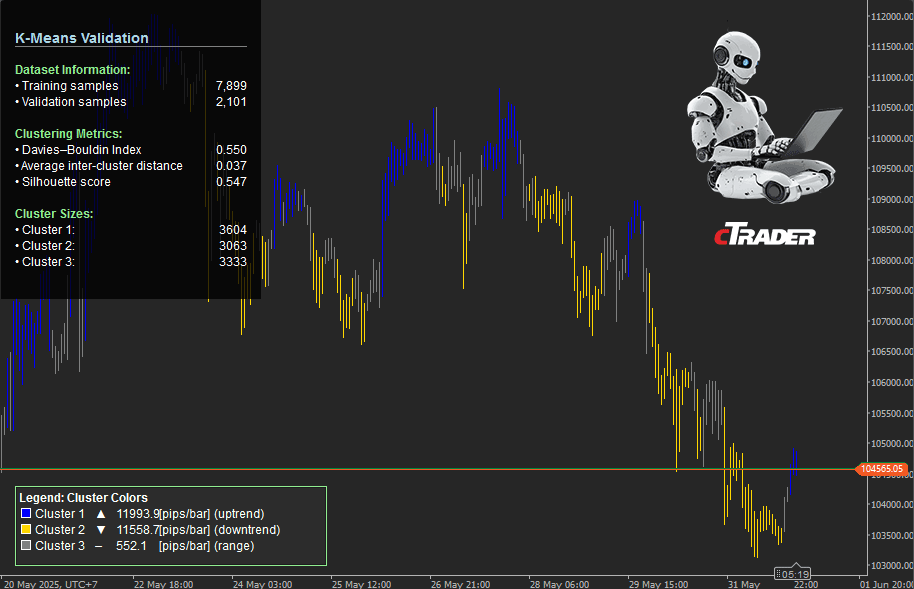
    Colouring Process of the Indicator

    The initial colouring of the indicator is a fundamental aspect, established during the initialization phase and based on indices preceding the current ones. In a one-hour time frame, the update of the colouring is synchronized with the completion of this period. It's important to note that historical candles are not beneficial for traders looking for strategies with old clusterizations, as they do not represent current trading opportunities. Additionally, the implemented code, in line with the guidelines of the guide and already integrated into the system, will restrict new colouring. This limitation may hinder access to future trading opportunities, especially if license validation is carried out.


    Indicator Behavior Outside of Trading Sessions

    Regarding the indicator's behaviour during periods when trading sessions are not conducted, it has been noted that it displays the message "Loading data and training model". This message is part of the indicator's initialization method and will remain visible until the calculation process is active or until Forex trading resumes. This behaviour is a standard response of the system to trading inactivity.

    Comment on Limiting Clusters to 6

    I have decided to limit the number of clusters to 6 to ensure that a reduced number of them is effective in any situation and time frame. This limitation ensures that each cluster has enough data to be statistically robust. This is particularly important for the value associated with the historical true range and for the effectiveness of the K-means model in correctly identifying each cluster, avoiding leaving any with a null value.


    Rationale Behind the Choice of 6 Clusters

    The choice of 6 clusters is logical and feasible. This number allows for segments 2, 3, or 4 signals per bullish or bearish trend. In doing so, it avoids overwhelming the user with excessive information and reduces the hesitation that may arise when observing an excessive number of clusters in real-time.


    Considerations on Clustering and Data Quality

    A higher number of clusters could increase the probability that the clustering is not effective for each one. This is because as the number of clusters increases, some might end up capturing simply market noise, which would decrease the precision and utility of the clustering. This observation underscores the importance of balancing the number of clusters and the data quality obtained.


    Maximum Timeframe

    Daily in Forex, although the indicator can support other financial markets such as cryptocurrencies in lower times, stocks, and commodities, it is preferable due to the amount of forex data to focus this product on this financial market.


    ctrader machine learning indicator


    How to use it?

    Historical True Range (HTR): This indicator measures market volatility over a specific period and is essential for assessing market instability and adjusting trading strategies accordingly.

    Price Range: Indicates the variation in pips between the closing prices at the beginning and end of a cluster. A wider range may signal a strong trend or a significant change in market direction.

    Trend Directions: These are identified through the historical average of cluster volatility and are visualized on charts with specific colours, using upward arrows for bullish trends and downward arrows for bearish ones.


    Cluster Configurations:

    Two Clusters: Focus on detecting bullish and bearish trends, allowing for tailored strategies for these specific movements.

    Three Clusters: In addition to identifying bullish and bearish trends, they incorporate the ability to identify seasonal periods, providing a more comprehensive view of market behaviour.

    More Than Three Clusters: Offer a more detailed and granular analysis, ideal for strategies that require a deep understanding of complex market patterns.


    Integration with Indicators such as Stochastic or MACD

    Complementarity: These indicators are used in conjunction with the HTR and Price Range to obtain a more complete view of market dynamics.

    Confirmation of Signals: They can confirm the signals of volatility and trend strength indicated by the HTR and Price Range. For example, an extreme value in the Stochastic or a crossover in the MACD can corroborate a potential trend reversal suggested by a significant change in the Price Range.

    Entry and Exit Points: The integration of these indicators can help identify more effective entry and exit points in trading, especially when their movements align with changes in the HTR.

    In summary, the integration of indicators such as Stochastic or MACD with the Historical True Range and Price Range within a machine learning framework for automated trading forms a comprehensive strategy. This approach leverages the strengths of each indicator to enhance the accuracy and efficacy of market predictions and decisions.


    Number of Clusters (K-Means)

    • Parameter Name: "Number of Clusters (K-Means)"
    • Default Value: 2
    • Range: 2 to 6 clusters
    • Purpose: Determines the number of clusters to be used in the K-Means clustering algorithm. This affects how the market data is segmented and analyzed.


    Number of Previous Bars (K-Means)

    • Parameter Name: "Number of Previous Bars (K-Means)".
    • Default Value: 8000 bars
    • Range: 2500 to 10000 bars
    • Purpose: Specify the number of previous bars to consider for the K-Means clustering. This setting influences the depth of historical data used in the analysis.
    • RSI Indicator:


    Parameter Name: "RSI Period"

    • Default Value: 14
    • Range: 7 to 28
    • Purpose: Sets the period over which the Relative Strength Index (RSI) is calculated. RSI is a momentum indicator used to identify overbought or oversold conditions.


    ADX Indicator

    • Default Value: 14
    • Range: 7 to 28
    • Purpose: Determines the period for the Average Directional Index (ADX). ADX measures trend strength regardless of trend direction.


    ATR Indicator

    • Parameter Name: "ATR Period"
    • Default Value: 14
    • Range: 7 to 28
    • Purpose: Specify the Average True Range (ATR) indicator period. ATR is used to measure market volatility.


    ATR Moving Average Type

    • Parameter Name: "ATR Moving Average Type"
    • Default Value: Exponential
    • Purpose: Sets the type of moving average applied to the ATR. Choices often include simple, exponential, and others. This affects how the ATR values are smoothed over time.


    Cluster Color Settings

    • Parameters: Color of Cluster 1 to 6
    • Default Values: Blue, Yellow, Gray, Red, Fuchsia, Light Blue
    • Purpose: These settings allow customization of the colour representation for each cluster. This aids in the visual differentiation of the various market segments identified by the K-Means algorithm.


    Symbols Supported

    The following symbols are supported by this indicator, make sure you check if the symbol you wish to trade is supported.


    cTrader Symbols Supported


    ctrader metals


    ctrader crypto


    How To Install & Remove

    First, make sure you have the cTrader trading platform installed, unzip the file and double-click on it to automatically install it onto the platform. The file that is installed can be found in your indicators folder.


    Any Questions?

    If you have any questions, please first search our product help forum for the answer, if you cannot find it, post a new question.


    Need a Broker

    If you are still looking for a broker you can trust, take a look at our best cTrader broker site.