The Direction Correction Target (DCT) indicator measures all necessary trend Direction, possible Correction and possible Targets, the indicator has also commented on the right side of the chart "Prefer Sell, Buy Above, H4 Target, Daily Target ... " and “Range N” – N pips – to know potential range size at Hour4 and Daily Time Frames. DCT is an unambiguous algorithm, it has No variable parameters. You will have no more stress wondering which setting of period, type etc is better.
If you want to be shown where to enter, exit and take profit then this tool is for you.
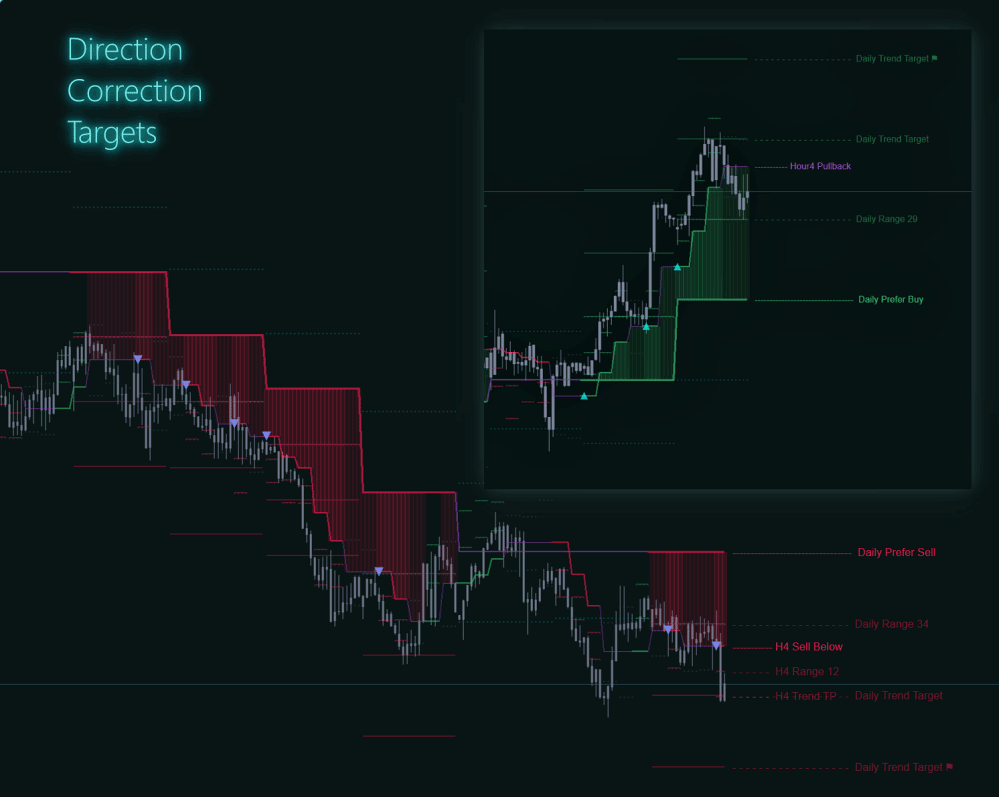
- LEVELS: DCT is a technical indicator Without Redrawing - Levels are always standing still. Daily and H4 levels are the most important Support / Resistance.
- COLORS: colours are more sensitive – it's changing - is Not simple up / down logic - but a more complicated formula with an important purpose.
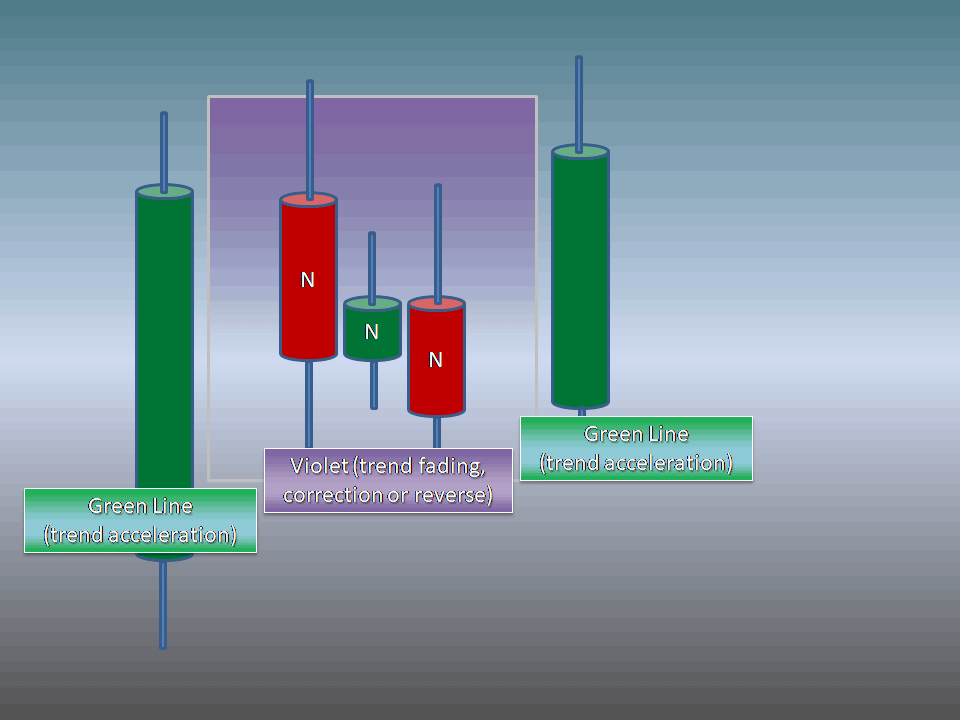
It is very hard to trade while the price goes opposite to the previous big move – we can’t know for sure – is it just correction, or it will be a trend reversal. And there can be many N candles flirting with traders emotions. That is why this phase is coloured Violet – just Nothing to do here.
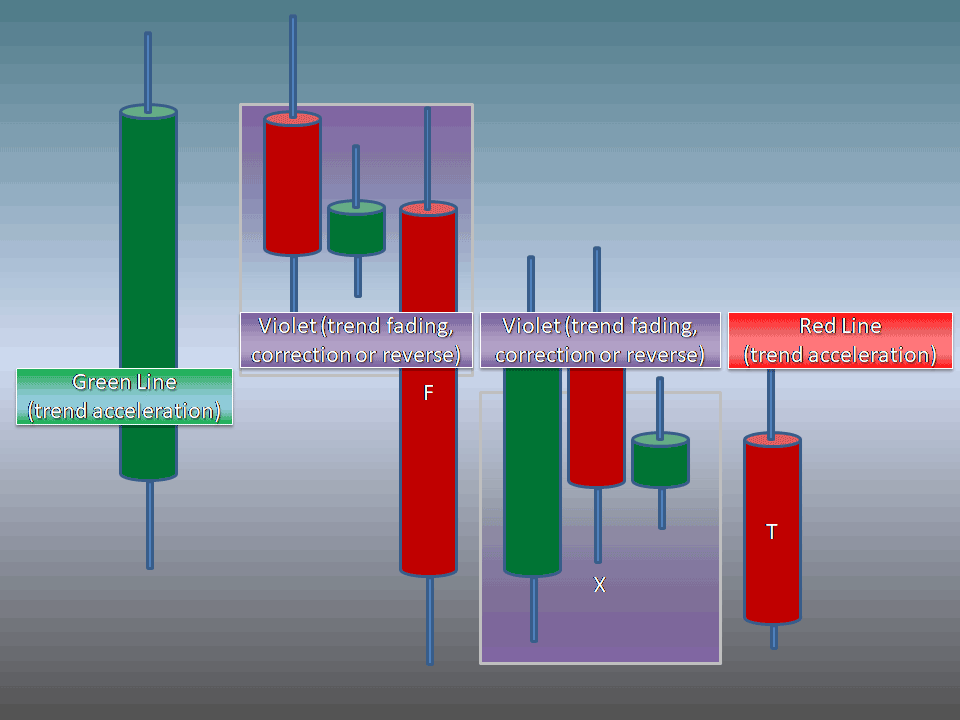
And here is another market trick – price goes down in a sharp move F.
Some people will immediately sell here, some will just close their buy positions. But it can be just a fake down move – before an even more powerful rocket up. So – this F candle can be even many times bigger – the indicator will still be Violet – because there are very low chances to figure out – is it reverse or just a very angry pullback to kick everybody off the game.
In most cases – the next day will be the day X – here price can rather jump back Above the Violet line – and the trend UP trend will go on, or – the price can settle Below the Violet line – and just AFTER that settlement – we can assume that there is the probability that price will go down.
But the line will still be violet…
The line will become Red only if that daily candle will really starts to achieve down acceleration.
BTW – no matter which time frame are you working at m5, m15, or Hour – DCT levels are NOT from your current time frame, but is loading and analyzing Daily, Hour4 and Hour to calculate and draw its levels.
Colours by DCT
If it is enabled - all chart candles are coloured, Gray. The logic is - it does not matter single candle goes up or down - it does matter Where this candle is located - in buyers' or sellers' territory. DCT is trying to define that - the territory of buyers or sellers - which is defined by DCT Lines and Clouds colours. This is done with the idea to get rid of confusion created by momentum down green\red candles. But if you wish to see standard coloured candles - just disable the "colours by DCT" parameter and set candle colours as whatever you wish.
Possible Strategy
To take the Daily DCT level as a big trend filter and to enter by Hour4 levels just After Violet phases. When price starts its next acceleration just after trend fading\correction\reverse.
DCT has also Hour levels … but it’s not so strong. Hour 4 is preferable.
- TARGETS: positions can behold till the trend structure is not broken, but our world and markets are changing very fast (or I have no patience) that is why small targets by Hour4 Volatility or bigger by Daily Volatility are necessary – for Taking Profits or at least for partial fast Take Profits.
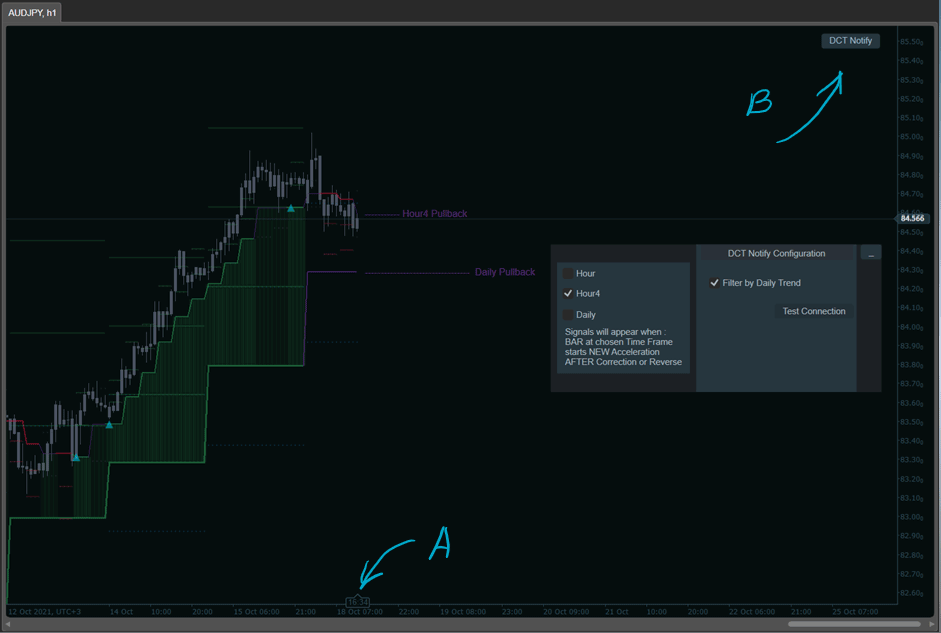
A: Drag the timer at the bottom of the chart a bit left – to make some space for DCT comments and the configuration panel.
B: Configuration Panel can be enabled with B Button. You can use checkboxes – to enable signals about new acceleration at the time frame you are interested in. The best option is to watch Hour4 signals with “Filter by Daily Trend” – it means that algo will give only such Hour4 which is the same direction as the bigger – Daily trend.
Telegram Notifications
There is an option to receive sound and \ or telegram notifications.
Windows 10 is required for telegram notifications.
- You need to have\to create your own Telegram bot. Instructions here (I suppose you have your own instructions about that)
- You need to find your own bot by searching in your telegram messenger and writing the first message to your bot. There will be a permission error like in the picture – if you will not make that first message with any text.
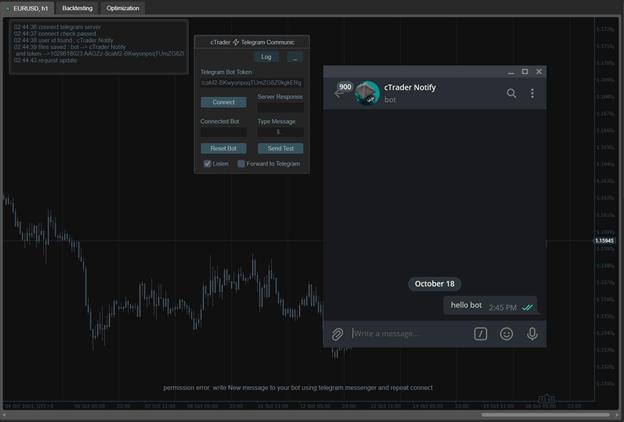
3. Wait at least 20 seconds after the message was sent then click “Connect” and you will see “Success”
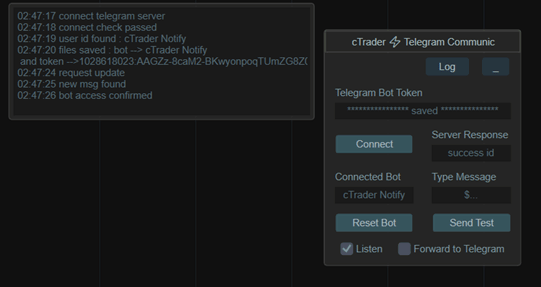
You can enable “Forward to Telegram” if you need messages – or disable that checkbox if you are near a PC and just need notifications log and sound.
Now you can run the Telegram Communic robot that was successfully configured - in ONE chart – and it will collect notifications from all other charts where you will apply the DCT indicator. You can also set some “buffer pips” so indicators will be less sensitive – to avoid choppy signals, or set the parameter to -1 and signals will be only after candles at your chart timeframe closings.
Need More Help Setting up Telegram?
If you are still having difficulties setting up and testing your telegram account watch the video tutorial.
Also, have a read of this forum thread where a customer needed our help.

How To Install & Remove
First, make sure you have the cTrader trading platform installed and then simply unzip the file and double-click on it to automatically install it onto the platform.
Any Questions?
If you have any questions, please first search our product help forum for the answer, if you cannot find it, post a new question.
Need a Broker
If you are still looking for a broker you can trust, take a look at our best cTrader broker site.


