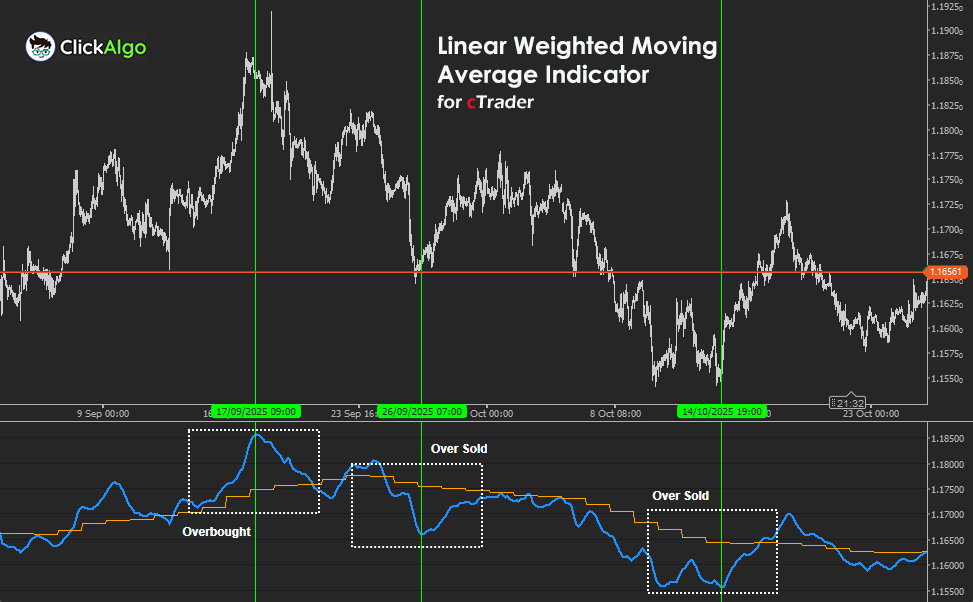
Indicator Overview
This indicator provides two synchronised moving averages: one from the current chart and another from a higher timeframe, such as H4, Daily, or Weekly. By weighting recent prices more heavily, the Linear Weighted Moving Average responds faster to changes in price than traditional moving averages. The dual-timeframe display allows traders to visually confirm when short-term trends align with or diverge from longer-term movements.
Background & History
The Linear Weighted Moving Average (LWMA) has been a key tool in technical analysis since the mid-20th century, designed to give greater importance to recent data while still considering longer historical context. Multi-timeframe analysis evolved later as traders recognised the importance of aligning short-term entries with broader market structure. This indicator brings both concepts together, offering a fast-reacting average that reflects higher-timeframe sentiment without switching charts.
How the Indicator Works
The LWMA MTF Indicator calculates two lines:
For each bar, the indicator computes a weighted sum of recent prices, assigning higher weights to the most recent candles. The higher-timeframe LWMA is calculated from the chosen timeframe’s data and aligned with the main chart’s bars for visual comparison. Traders can observe when the short-term LWMA crosses above or below the higher-timeframe LWMA to identify changes in trend structure or potential entry points.
Key Features
The indicator is built for traders who rely on cross-timeframe trend alignment and prefer a faster, more responsive moving average.
-
Displays two LWMAs simultaneously, one for each timeframe.
-
Uses price weighting to reduce lag and improve trend sensitivity.
-
Supports all common timeframes, including custom higher intervals.
-
Clear colour distinction between main and higher timeframe lines.
-
Provides a visual overview of short-term versus long-term momentum.
How to Use it for Trading
Traders can use the LWMA MTF Indicator to align entries with higher-timeframe trends. When the lower-timeframe LWMA rises above the higher-timeframe LWMA, it signals bullish momentum and potential buying opportunities. Conversely, when the short-term LWMA falls below the higher timeframe line, it suggests bearish sentiment or potential sell setups.
Scalpers can confirm trade direction before entering, swing traders can use it to ensure trades follow the dominant trend, and beginners can observe the interaction between short- and long-term averages to understand multi-timeframe alignment. Combining the LWMA MTF with volume or momentum indicators enhances signal reliability and reduces the likelihood of false breakouts.
Complimentary Indicators
The Linear Weighted Moving Average MTF becomes more powerful when used with tools that measure momentum, volatility, or volume.
-
MACD (Moving Average Convergence Divergence): Confirms momentum direction during LWMA crossovers.
-
RSI (Relative Strength Index): Helps avoid trades taken in overbought or oversold zones.
-
ATR (Average True Range): Useful for volatility-based stop-loss placement.
-
Volume Oscillator: Highlights volume strength behind confirmed LWMA trends.
Inputs & Parameters
The indicator includes flexible parameters allowing traders to control its behaviour across multiple timeframes.
| Parameter |
Default/Type |
Description |
| Source |
Close (DataSeries) |
The price source used for LWMA calculation such as Close, Open, or Typical price. |
| Period |
14 (int) |
Defines the number of bars used in the LWMA calculation. |
| Higher Time Frame |
Daily (TimeFrame) |
Specifies which higher timeframe’s LWMA to overlay on the main chart. |
Formula Explanation
The Linear Weighted Moving Average (LWMA) gives more importance to recent data points by multiplying each price by a weight that decreases linearly with age. For the higher-timeframe LWMA, the same formula is applied to the price data from the selected higher timeframe.
LWMA = ( Σi=1n (Pricei × Weighti) ) / Σi=1n Weighti
where Weighti = (n − i + 1)
Advantages
This indicator allows traders to view trend alignment across multiple timeframes without switching charts, saving time and improving situational awareness. It reacts faster than standard moving averages, helping capture early changes in momentum while maintaining a broader market perspective.
Disadvantages
Because the LWMA assigns greater weight to recent prices, it may generate false signals during short-lived market fluctuations. Additionally, when used on lower timeframes with a very high higher-timeframe selection, the lag between data updates may cause temporary mismatches in alignment.
How To Install & Remove
First, ensure the cTrader trading platform is installed. Then unzip the file and double-click it to automatically install the platform.
Need Extra Help?
Get instant answers with cTrader Sensei — our free AI assistant built for the cTrader platform. It can explain the indicator settings, suggest trading strategies, and guide you step-by-step in using this indicator. Rated 4.9 out of 5 in the ChatGPT Store.
Chat with cTrader Sensei.
Prefer human help? Visit our support forum where our team and community can assist you.


