The most significant market participants, named "big players" or "smart money", are those who move substantial volume in the market. This includes the largest banks, firms, global companies, insurance companies, Hedge Funds, as well as speculative traders around the world. The volume is so large that their position cannot be opened and closed in a single order without spiking the market. It is essential to understand that although the banks might control most of the daily volume, a large part of that volume is those banks acting as market makers for the other types of traders. If banks are primarily market makers, then they will, by default, drive the market to and from areas of supply and demand, which is the foundation of how we track them. It would be very interesting to identify where large market participants are likely to enter or exit their position based on likely areas of supply and demand, or manipulation points (trapping moves) as we term them because the top 10 banks control well over 60% of the daily forex market volume.
How to Use These Indicators for Manual Trading
The Volume Activity Indicator
The Volume Activity indicator will help you detect the most important volume changes in the market. Out-of-average volumes are a good signal that smart money or an institutional player got into the market. This tool will allow you to identify and define those entries and thus to determine the best strategy based on market cycles.
The Weis Wave Volume Indicator
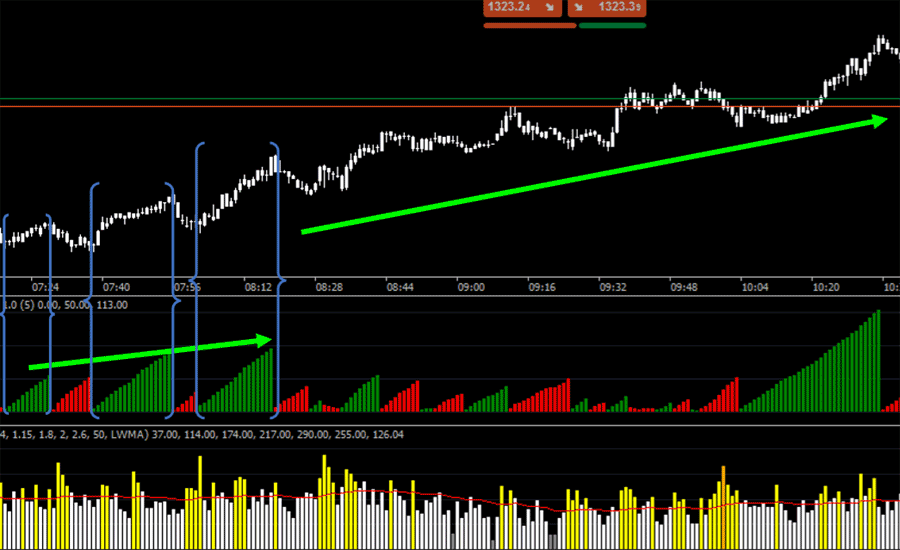
The Weis Wave Volume is an auxiliary tool that indicates how much order flux we have in the determinate wave. This tool separates and accumulates a volume of the up or down wave moves. The Weis Wave shows you the “movement fuel” or its intensity. If you have an increased cumulated volume in two successive waves, that implies adding fuel in the direction of the current movement. It gives a strong sign of continuity of motion. See the image below. The increasing cumulated buy (green) volume waves demonstrate that the players are willing to fuel the market uptrend which leads to a probable future price rise.

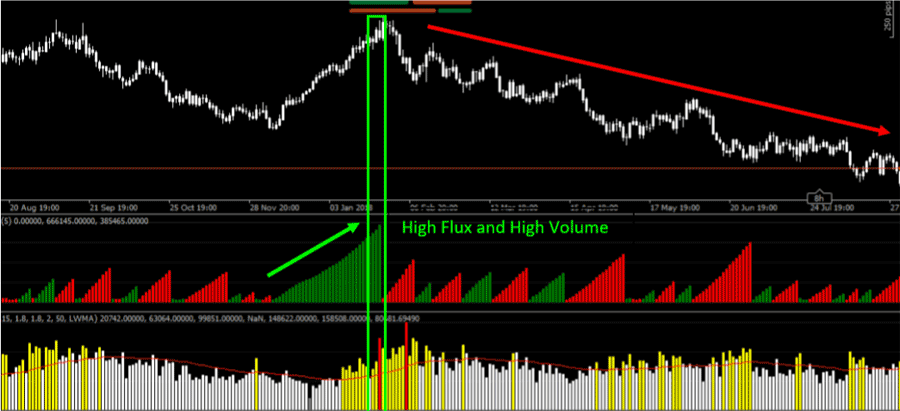
If you use the Weis Wave Volume associated with Volume Activity you can track the absorptions and aggressions of big players (banks, investment funds,…) in the market. Those indicators are complementary, and using both simultaneously is the best way to make out the big players' positions and future movements. As you can see in the image below, there is absorption that occurred on top. In the final moment of this large scale-up wave, you have a “red bar” on the Volume Activity (big player acting). This is a blatant sign of a big player’s absorption. Some big players are entering the seller side while the market promotes the liquidity on the buyer side. Look that after the absorption, the market trend is reversed and finally goes down. The absorption needs a high cumulated volume (flux) and high liquidity to actually give rise to a reversal in trend.

The Volume Activity shows you how much bigger is the present volume activity than the volume average (MA). The parameters are simple, and you can determine a multiplier factor to analyze the volume. You can set the colour displays and the MA-related factors of low volume, average volume, high volume, very high volume and ultra-high volume.

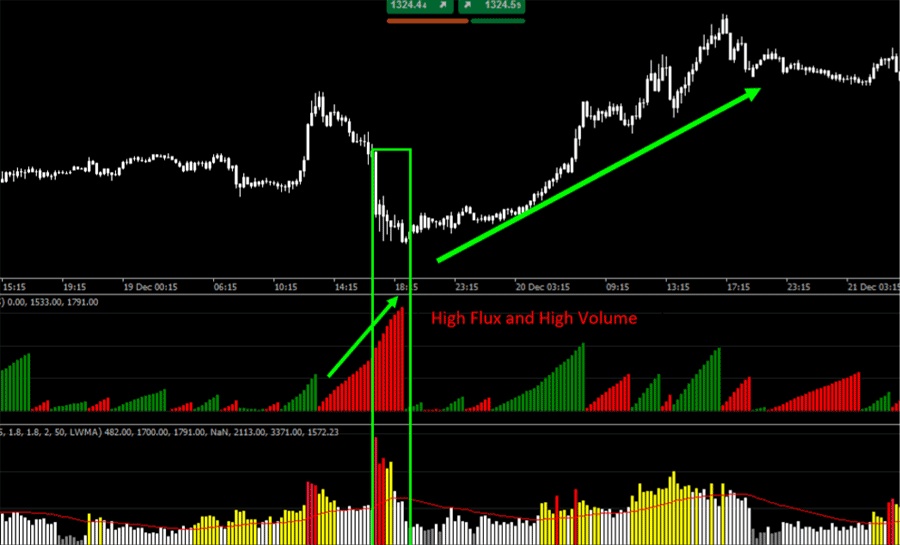
In the image above, you can see an obvious bottom absorption. In conclusion, those two indicators working together will clearly expose a big player's position and help you track his moves: aggression, absorption, accumulation or distribution.
Favourite Settings: Volume Activity
- Low Volume: Indicates the low volume activity. Not relevant to trade.
- Average volume: Indicate that exists an average activity in volume. Many traders are getting in the market. The liquidity is growing up.
- The High Volume: Is the signal that the liquidity is very high and there is a lot of possibilities that the big players are getting inside the market.
- Ultra-High Volume: The volume growing up very fast and this situation is clearly the big player's actuation and manipulation.
- Period: Is the parameter to define the period to calculate the volume moving average (MA).
- Mode: SMA or LWMA: Is the MA (Moving Average) calculate method. Linear or Simple.

These parameters are multiplier factor that defines how much bigger the volume is than the moving average (MA).
Favourite Setting: WeisWave
Depth is the criteria to define the calculate to zigzag waves and the waves up and waves down. The sets are adjusted between 5 – 12. It’s my favourite setting.
DI Weis Wave Volume Latest Update
Version 1.2
- Fix the missing bar issue on the chart's last bars.
- Fix the inverted wave colours during calculating.
How To Install & Remove
First, make sure you have the cTrader trading platform installed and then unzip the file and double-click on it to automatically install it onto the platform.
Any Questions?
If you have any questions, please first search our product help forum for the answer, and if you cannot find it, post a new question.
Need a Broker
If you are still looking for a trustworthy broker, look at our best cTrader broker site.
Need Coding Help?
If you need help creating your customised automated trading system, contact our development team for a quote.


