Indicator Overview
This indicator builds on the traditional MACD by adding volume-based confirmation and adaptive chart elements. Instead of just comparing moving averages, it shows the relationship between price momentum and tick volume, highlighting when activity is rising, falling, or flat. High and low markers are drawn to show recent extremes, and traders receive simple on-chart alerts when crossovers occur. The aim is to provide a more comprehensive view of momentum combined with participation.
Background & History
The MACD, or Moving Average Convergence Divergence, was created by Gerald Appel in the late 1970s. It became one of the most widely used momentum indicators in technical analysis, often paired with signal lines and histograms to show bullish and bearish phases. While effective, traders often combine MACD with volume studies to avoid false signals. This advanced version does exactly that, offering a modern update that integrates tick volume with MACD calculations.
How the Indicator Works
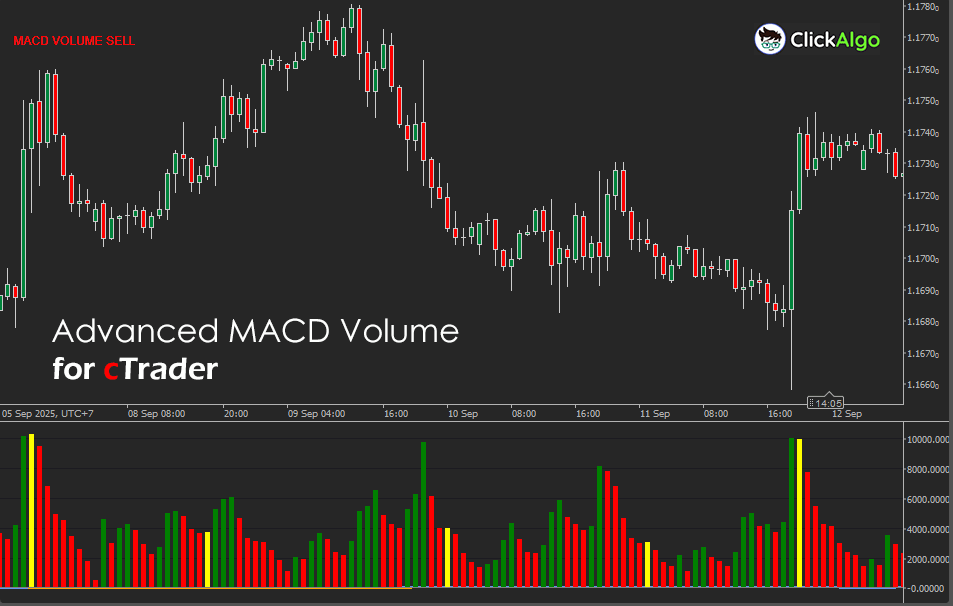
The Advanced MACD Volume Indicator calculates the difference between a short-cycle and long-cycle moving average of price, then applies a signal line to smooth the results. This value is scaled for better chart visibility and displayed as a top line versus a zero baseline. At the same time, the indicator monitors tick volumes. If volumes increase above a set threshold, they are marked in green, while decreases appear in red and neutral levels in yellow. The tool also draws horizontal lines showing the highest and lowest MACD values within a lookback period, helping traders identify key zones. Finally, alerts appear on the chart when the MACD line crosses the signal line, indicating potential buy or sell opportunities.
Key Features
The indicator provides a multi-layered view of momentum and volume in one panel. Traders can easily see not only when price momentum shifts but also whether volume supports the move.
-
MACD line, signal line, and zero line for clear trend direction.
-
Smoothed moving average option with multiple calculation types.
-
Volume histogram with green, red, and yellow bars.
-
Automatic high and low markers across a set period.
-
Buy and sell text alerts directly on the chart.
How to Use it for Trading
Traders can interpret the MACD crossovers in the usual way:
-
A bullish condition appears when the MACD line crosses above the signal line, often suggesting upward momentum.
-
A bearish condition appears when the MACD line crosses below the signal line, suggesting downward momentum.
Volume confirmation strengthens these signals. Green volume bars suggest stronger participation behind the move, while red bars suggest weakness or selling pressure. Yellow indicates quieter activity, where signals may be less reliable.
Beginners can start by applying the indicator on higher timeframes such as H1 or H4, watching for MACD crossovers that align with trend direction and are supported by green volume. More advanced traders can combine it with risk management rules such as stop-loss placement below recent lows or above recent highs.
Inputs & Parameters
This indicator offers a range of inputs to help traders fine-tune signals and adapt to different markets.
| Parameter |
Default/Type |
Description |
| MACD Long Cycle |
26 (int) |
Number of periods for the long EMA in MACD. |
| MACD Short Cycle |
12 (int) |
Number of periods for the short EMA in MACD. |
| MACD Signal Period |
9 (int) |
Number of periods used for the MACD signal line smoothing. |
| MA Type |
Exponential |
Moving average for additional smoothing. |
| MACD Scale Factor |
10000 (double) |
Scaling factor to adjust MACD values for better chart display. |
| High/Low Lookback Period |
100 (int) |
Number of bars used to calculate recent highs and lows. |
| Volume Change Threshold % |
2 (double) |
The percentage change in volume required to color bars as up or down. |
The Advanced MACD Volume Indicator is based on the standard MACD calculation, scaled and combined with volume percentage changes.
MACD = EMAShort(Close) − EMALong(Close)
Signal = EMASignalPeriod(MACD)
Histogram = (MACD − Signal) × ScaleFactor
Volume Change % = ((CurrentVolume − PreviousVolume) ÷ PreviousVolume) × 100
Advantages
The Advanced MACD Volume Indicator combines two critical aspects of analysis: price momentum and trading activity. This helps filter out false signals and makes the tool more responsive. Its built-in alerts and high/low markers give traders an immediate understanding of conditions without needing extra tools.
Disadvantages
Like any indicator, it is not foolproof. It can generate false signals in low-volume or sideways markets, and the scaling factor may require adjustment depending on asset type. Relying on it without additional confirmation or risk management could lead to poor trades.
How To Install & Remove
First, ensure that you have the cTrader trading platform installed. Then, unzip the file and double-click it to install the platform automatically.
Need Extra Help?
Get instant answers with cTrader Sensei — our free AI assistant built for the cTrader platform. It can explain the indicator settings, suggest trading strategies, and guide you step-by-step through the use of this indicator. Rated 4.9 out of 5 in the ChatGPT Store.
Chat with cTrader Sensei.
Prefer human help? Visit our support forum where our team and community can assist you.
Note: cTrader Sensei runs on OpenAI's ChatGPT platform. To use it, you will be asked to create a free OpenAI account. Registration is quick and costs nothing.
The free version works immediately, but upgrading to a ChatGPT Plus subscription unlocks the latest GPT model, which provides more accurate and detailed answers for trading, coding, and product support.
Need a Broker
If you're still looking for a broker with tight spreads and fast execution, visit our top cTrader broker site.


