Indicator Overview
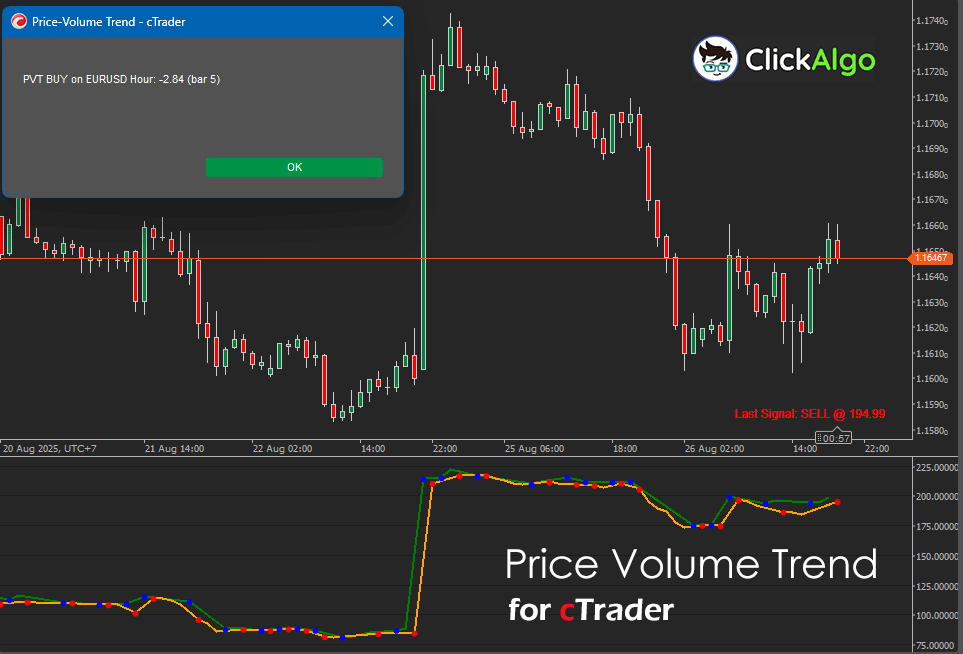
This indicator accumulates price change scaled by tick volume to form a running Price Volume Trend. It then splits the series into rising and falling segments, paints them as green and orange lines, and emits buy or sell markers when the trend direction changes beyond a chosen sensitivity threshold. A status label displays the last signal for instant context.
Background & History
Price Volume Trend has been used for decades to blend price movement with participation. The aim is to detect when a small price move on large volume matters more than a big move on thin volume. This version modernises PVT by separating up and down pressure, adding signal logic, and providing configurable alerts for live trading workflows.
How the Indicator Works
On each bar, the indicator computes the relative price change and multiplies it by tick volume, accumulating the result into a continuous PVT line. Rising segments are mapped to the PVT Up line, falling segments to the PVT Down line. When the series switches direction and the absolute change exceeds a user-defined threshold, a buy or sell marker is plotted, and the last signal label is updated.
- Rising segments appear as the green PVT Up line, falling segments as the orange PVT Down line.
- Buy markers that print on flips from falling to rising that pass the threshold.
- Sell markers print on flips from rising to falling that pass the threshold.
- A static text label shows the most recent signal in your chosen corner.
Key Features
The tool is designed for fast visual reads and straightforward automation. Display modes let you focus on both directions, rising only, or falling only, while alerts keep you informed without watching the screen full time.
- Split PVT into rising and falling lines for immediate bias recognition.
- Direction change signals with adjustable sensitivity to filter noise.
- Optional pop-up and email alerts on new buy or sell events.
- Last signal label anchored to any chart corner for quick status checks.
How to Use it for Trading (at a glance)
The Price Volume Indicator is designed to help you read the balance of pressure between rising and falling momentum, with volume acting as the weight of conviction. You can use it in several ways depending on your style:
- Use both lines (default) when you want the complete picture of how PVT accumulates in both rising and falling phases. Buy signals will appear when the PVT flips upward with strength, and sell signals will appear when it flips downward with significance.
- Switch to RisingOnly mode if you want to focus exclusively on upside momentum. In this mode, only the green PVT Up line will show, and only buy signals will be plotted. This is useful when you are testing long-only strategies or trading in a strong uptrend.
- Switch to FallingOnly mode if you want to concentrate on downside momentum. Only the orange PVT Down line will show, with sell signals plotted. This mode helps you evaluate short-side opportunities or manage risk in downtrends.
Practical trade usage examples:
- Trend continuation entries: When price pulls back into support during an uptrend, wait for a new buy signal as the PVT flips back to rising. This helps confirm that buying interest has returned with volume support.
- Reversal spotting: If the market has been rising but a sell signal appears as the PVT flips down on significant volume, this may mark exhaustion or a change in sentiment. Combine with candlestick patterns or resistance zones for higher conviction.
- Filter trades: Pair the indicator with moving averages or structure. For example, only take long trades when both your system and the PVT are showing buy signals in RisingOnly mode.
- Exit management: When you are in a long trade and the PVT prints a sell signal, consider tightening your stop or scaling out, since volume-backed selling pressure may now dominate.
The flexibility to show or hide the rising and falling components means you can strip the indicator down to the one side that matters most to your system, keeping charts uncluttered and focused on your trading plan.
Inputs & Parameters
These inputs control the source price, the influence of volume, the sensitivity of signals, and how information is displayed or alerted. Start with defaults, then tune the threshold to balance responsiveness and noise.
| Parameter |
Default / Type |
Description |
| Inputs |
| Source |
Close, PriceType |
Price used in the PVT calculation: Open, High, Low, Close, Typical, Median, or Weighted. |
| Volume Multiplier |
1.0, double |
Scales tick volume’s impact on the accumulation, increasing to amplify moves, and decreasing to smooth. |
| Signals |
| Signal Sensitivity Threshold |
0.0001, double |
Minimum absolute one-bar PVT change needed to validate a direction flip as a signal. |
| Display |
| Text Position |
TopRight, CornerPosition |
Corner for the last signal label, TopLeft, TopRight, BottomLeft, BottomRight. |
| PVT Display Mode |
Both, PVTDisplayMode |
Show both lines and both signals, or restrict to RisingOnly or FallingOnly. |
| Alerts |
| Enable Popup Alert |
false, bool |
Shows a pop-up message when a new buy or sell signal is generated. |
| Enable Email Alert |
false, bool |
Sends an email on new signals, requires a configured SMTP in cTrader. |
| Email To |
you@example.com, string |
Recipient address for email alerts. |
Formulas
The Price Volume Trend accumulates relative price change weighted by volume. This implementation also gates signal events by a sensitivity threshold.
Relative Change: Δt = (Pricet − Pricet−1) ⁄ Pricet−1
PVT Accumulation: PVTt = PVTt−1 + Δt × Volt × VolumeMultiplier
Rising and Falling Lines: PVTUpt = { PVTt if PVTt ≥ PVTt−1, NaN otherwise }, PVTDownt = { PVTt if PVTt < PVTt−1, NaN otherwise }.
Signal Condition: Buy when PVT flips from falling to rising and |PVTt − PVTt−1| > Threshold. Sell when PVT flips from rising to falling and |PVTt − PVTt−1| > Threshold.
Advantages
It blends price movement with participation to prioritize meaningful moves, highlights direction changes with simple markers, and offers flexible display modes and alerts for different trading styles.
Disadvantages
Tick volume is a proxy and can vary by broker, sensitivity that is too low may create noise, sensitivity that is too high may miss early turns, and direction flips work best with confirmation from price structure.
How To Install & Remove
First, ensure that you have the cTrader trading platform installed. Then, unzip the file and double-click it to install the platform automatically.
Need Extra Help?
Get instant answers with cTrader Sensei — our free AI assistant built for the cTrader platform. It can explain the indicator settings, suggest trading strategies, and guide you step-by-step through this indicator. Rated 4.9 out of 5 in the ChatGPT Store.
Chat with cTrader Sensei
Prefer human help? Visit our support forum where our team and community can assist you.
Note: cTrader Sensei runs on OpenAI's ChatGPT platform. To use it, you will be asked to create a free OpenAI account. Registration is quick and costs nothing.
The free version works immediately, but upgrading to a ChatGPT Plus subscription unlocks the latest GPT model, which provides more accurate and detailed answers for trading, coding, and product support.
To upgrade, log in to ChatGPT, click your profile in the bottom left, and select Upgrade to Plus.
Need a Broker
If you're still looking for a broker with tight spreads and fast execution, visit our top cTrader broker site.


