Market sentiment describes the general mood or outlook of investors and traders toward a specific financial market, asset, or the economy as a whole. It captures market participants' shared emotions— optimistic, pessimistic, fearful, or confident—and can play a significant role in driving price movements.
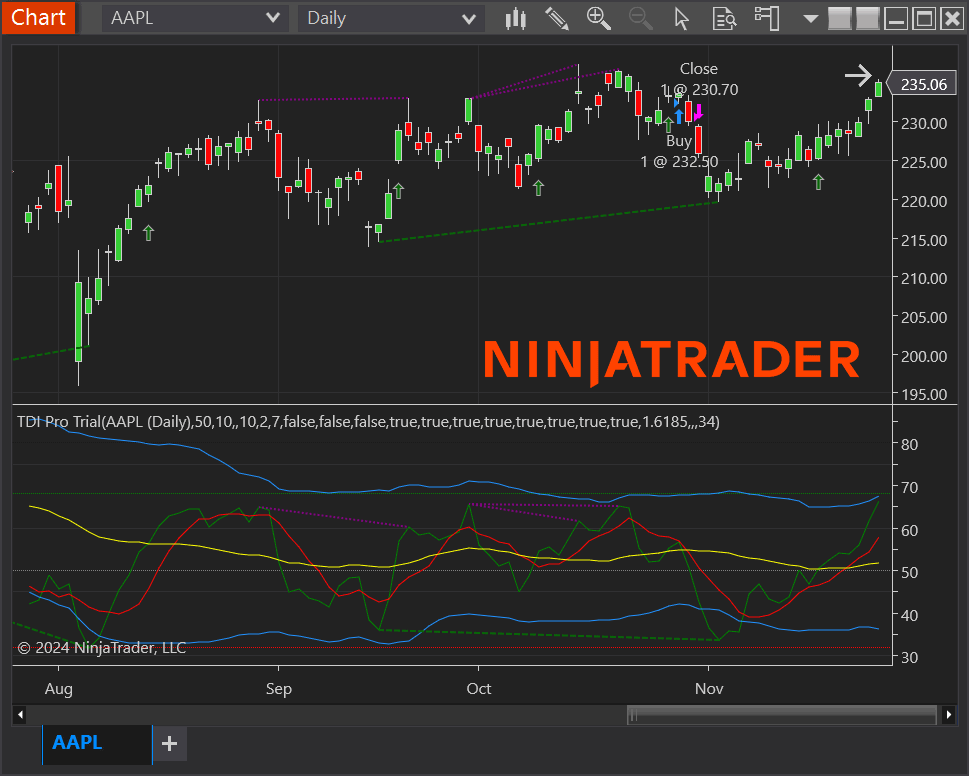
Structure of the TDI Pro Indicator
The TDI Pro's structure consists of five lines and five levels. The information below will help you understand how to read the indicator lines.
- Greenline - RSI Price Line
- Redline - Trade Signal Line
- Yellow line - Market Base Line
- Blue lines - Upper and Lower Volatility Bands
- 80 level – Extreme overbought conditions
- 68 level - Upper-level line: Buying Exhaustion (overbought condition)
- 50 level - Mid level line: Median point between Positive and Negative sentiment
- 32 level - Lower-level line: Selling Exhaustion (oversold condition)
- 20 level – Extreme oversold conditions
Relative Strength Index Line
The RSI Price Line (RSI PL) is a current price action sentiment profile. It is designed to show both agreement and divergence compared to price action. The 50 level is the dividing line between positive and negative sentiment. How to view the RSI Line:
- RSI > 50: positive market sentiment.
- RSI < 50: negative market sentiment.
- RSI > 68: Entering overbought conditions, buying momentum will slow and reverse.
- RSI < 32: Entering oversold conditions, selling momentum will slow and reverse.
- If the RSI line rises and < 50, sellers are covering, and buyers begin to buy.
- If the RSI line falls and is> 50, buyers exit, and sellers start to sell.
Signal Line
The Trade Signal Line (TSL) is a lagging moving average of the RSI Price Line. How to view the signal line:
- Greenline > Red Line: exit a buy or enter a sell position.
- Greenline < Red Line: exit a sell or enter a buy position.
- When entering a trade, always consult the overbought/oversold levels.
Market Base Line
The Market Baseline (MBL) represents the overall market trend. When the MBL is rising, the market's stronger trend is upward. When the MBL falls, the market's stronger trend goes downwards. The primary base of the MBL is the 50 level. One of the most unique aspects of the MBL is forecasting potential market reversals in larger time frames. Market reversals generally occur after the MBL is >= 68 or = 32.
How to view the Market Base Line:
- RSI > Yellow & Yellow is flat or trending up … consider entering a buy.
- RSI < Yellow & Yellow is flat or trending down … consider entering a sell.
- If Yellow <= 32, be prepared for a Long market reversal.
- If Yellow >= 68, be ready for a Short market reversal.
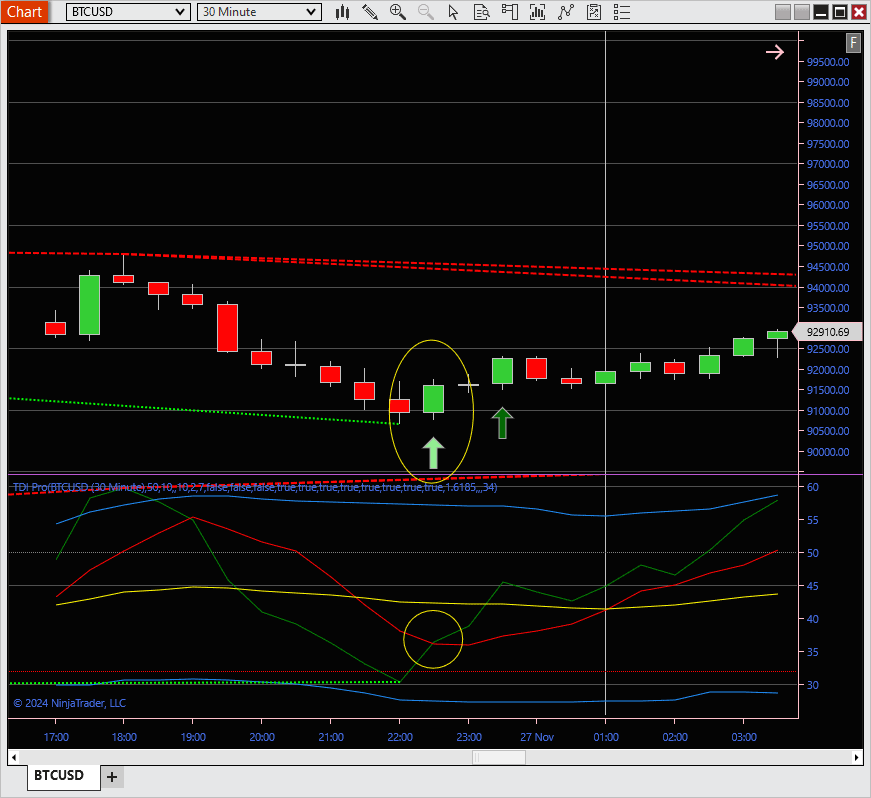
From time to time, current price action will converge with the overall market trend and attempt to break it. This is illustrated by the Greenline moving sharply towards the Yellow line. If the overall market trend is unyielding, the Greenline will “bounce” off the Yellow line, as shown in the highlighted circle in the picture below.
Hint: When the Green and Yellow lines converge, consider economic events that might strengthen the current price and cause a market reversal that is strong enough to break the overall trend direction.
Volatility Bands
The Volatility Bands (VB) add another facet of market sentiment – strength and weakness. Two blue lines typically run outside the RSI PL, TSL, and MBL represent it. It is a self-adjusting band showing the strengths and weaknesses of the rate of change in price. As prices slowly tighten into a narrow range, the market slows down and the blue lines of the VB contract or squeeze together. This is a sign of weakness in the market. As prices rise or descend sharply, the market trends with increasing volatility and the blues lines widen – a sign of strength.
Using the TDI Pro, traders can use four trading techniques with the VB.
- Trade a breakout when a VB Squeeze occurs. Trade Long if a VB Squeeze is near the 32 levels. Trade Short if a VB Squeeze is near the 68 levels. The market can break if a VB Squeeze is near the 50 level. Evaluate price and economic events to determine which direction to trade or wait for the breakout.
- Add to a position:
- If in a Long position, add when the Greenline crosses VB, trending between 50 and 68.
- If in a Short position, add when the Greenline crosses V, B trending down between 50 and 32.
- Exit a position:
- If in a Long position, Green > upper VB crosses below VB back towards the 50 levels.
- If in a Short position, if Green < lower VB and crosses above VB back towards the 50 levels.
Trend Signals - TDI Cross Alert
When the TDI RSI Price (Green) line and Trade Signal (Red) line cross over, an arrow will appear on the price chart (Pale Green or Pale Red). The arrow indicates a crossover based on a shift in sentiment related to the current price action. A green crossing above Red indicates a potential Long entry, whereas a Green crossing below Red indicates a potential Short entry.
Trade Signals - MBL Cross Alert
When the TDI RSI Price (Green) line and Market Base (Yellow) line cross over, an arrow (Green or Red) will appear on the price chart. The arrow indicates the directional sentiment of current price action compared to the direction of the overall trend represented by the Market Baseline.
It is generally most favourable to trade a Cross Alert in the trend direction of the Yellow line. This crossover typifies the smaller (intraday) trend following the more significant (overall) trend. An MBL Cross Alert could signal a potential reversal if the Yellow Line is flat.
Trade Signals - TDI Hook Alert
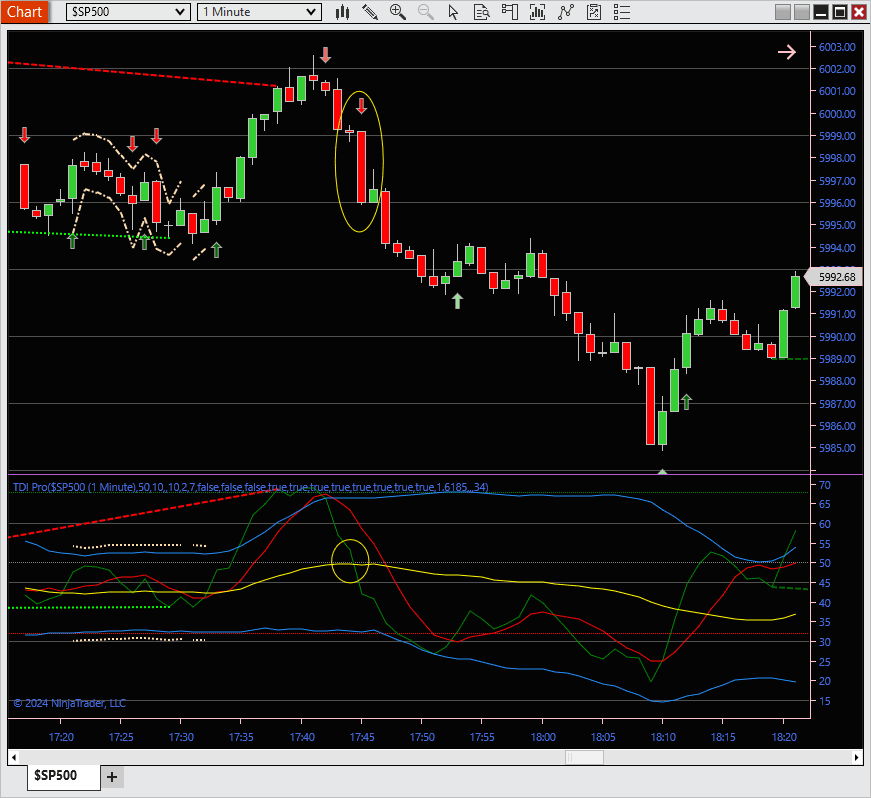
When the RSI Price (Green) line is above the upper Volatility Band (VB) and rolls down or below the lower Volatility Band and rolls up, the appearance of the Greenline is similar to a fish hook; hence, the name of this alert. Unlike the previous two alerts, the TDI Hook is a counter-trend alert informing traders of the market attempting to return to a norm during an overbought or an oversold condition.
When the RSI Price line is above the 68 levels and the upper Volatility Band and then “hooks down” below the upper Volatility Band, this condition suggests a Short opportunity.
When the RSI Price line is below the 32 levels and the lower Volatility Band and then “hooks up” above the lower Volatility Band, this condition suggests a Long opportunity.
In either case, market sentiment is fading from the current price trend. Prices are too high, and buyers are reluctant to buy higher and start to close Long positions. Or prices have fallen too low, and sellers are not selling but instead closing Short positions.
Even though a TDI Pro Hook alert triggers, traders should be aware when trading counter-trend that the price may continue stubbornly moving in the direction of the trend due to market-related economic events or news-related announcements. In this case, the TDI Hook Short alert will weaken as the price rallies, whereas the TDI Hook Long alert will falter as the price fades.
Hint: When trading the TDI Hook, monitor the trend of the Market Base Line.
- If the Market Baseline shows a downward sloping angle during a TDI Hook Long alert, watch for price continuation Short.
- If the Market Base Line shows an upward sloping angle during a TDI Hook Short alert, be watchful for price continuation Long.
- If trading a TDI Hook, consider setting a Stop Loss order just above the previous High of the TDI Hook Short or below the last Low of the TDI Hook Long.
Trading the Hook against the overall trend has more significant risks. Scalp trade when against the trend.
Generally, the better TDI Hook trades are trading retracements of the overall trend back in the direction of the overall trend.
Divergence Signals
Divergences are critical signals in technical analysis, offering insights into potential price movements. There are two main types of divergence: Regular and Hidden, each with a Bullish or Bearish directional bias. Users can customize the minimum and maximum distance to identify divergence signals, tailoring the analysis to their preferences.
Imagine the following scenarios in different market trends:
In an Uptrend Market
Hidden Bullish Divergences:
This type of divergence often signals the “bottom” of the trend channel, suggesting the potential for prices to rise and possibly reach the channel's top.
- What happens? The indicator forms a lower low, while the price forms a higher low.
- What does it mean? This discrepancy indicates upward momentum, implying the trend will continue higher.
Regular Bearish Divergences:
This divergence typically highlights the “top” of the trend channel, indicating the potential for a price pullback, possibly towards the lower end of the channel.
- What happens? The indicator forms a lower high, while the price forms a higher high.
- What does it mean? This suggests that the price may need to consolidate or retrace to regain balance.
In a Downtrend Market
Hidden Bearish Divergences:
These divergences often signal the “top” of the trend channel, pointing to further downward price movement, possibly towards the bottom of the channel.
- What happens? The indicator forms a higher high, while the price forms a lower high.
- What does it mean? This divergence signals continuing downward momentum in the trend.
Regular Bullish Divergences:
This divergence usually marks the “bottom” of the trend channel, hinting at a potential price retracement, possibly to the upper part of the channel.
- What happens? The indicator forms a higher low, while the price forms a lower low.
- What does it mean? This indicates that the price may consolidate or retrace higher to correct the trend.
By recognizing these divergence signals in both uptrend and downtrend markets, traders can better anticipate potential price movements and make informed decisions.
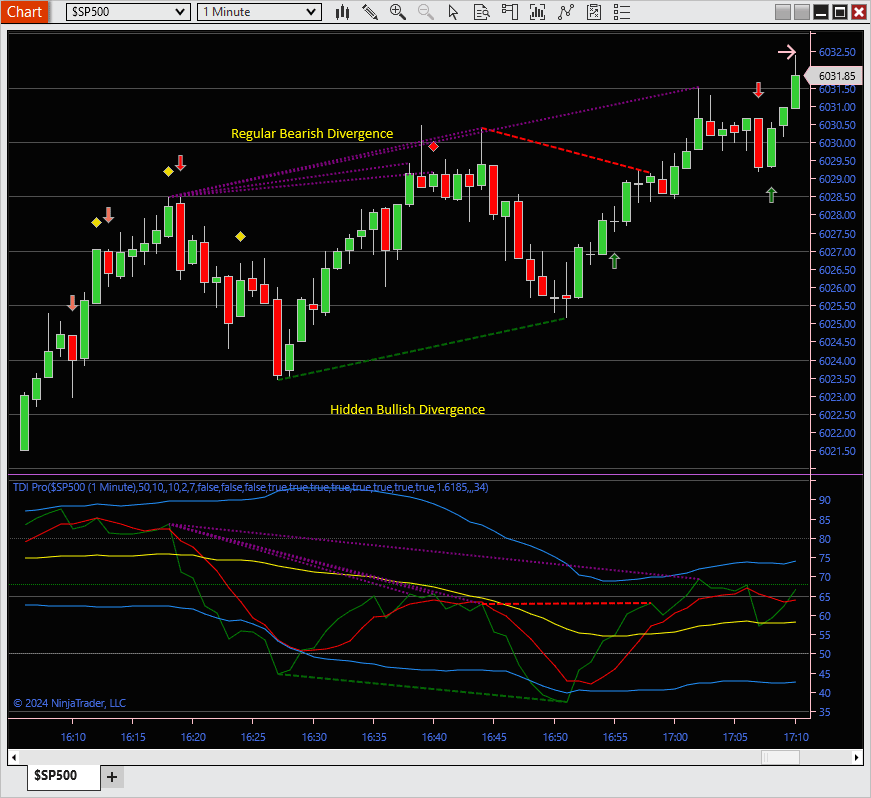
In either case, a trader looks for a potential price-action reversal.
Regular divergence is best used to compare the current Swing High or Low to the previous Swing High or Low. The trend is weakening with regular divergence, and market sentiment has shifted in the opposite direction. Traders can prepare to trade a favourable reversal or retracement.
In the TDI Pro, regular divergence is shown as follows:
- Bullish Regular Divergence – Green narrowly Dashed Line.
- Bearish Regular Divergence – Purple narrowly Dashed Line
NOTE: Divergence Lines appear at the bar's opening following a confirmed divergence.
Hidden Divergence, in its simplest terms, is when:
- TDI Pro Greenline is making lower lows while the price is making higher lows, which is potentially long.
- TDI Pro Greenline is making higher highs while the price is making lower Highs: a potential Short.
In either case, a trader looks for a potential continuation in price action.
Hidden divergence is best used to assess prices related to the prevailing trend. After a pullback, the price will often continue in the direction of the trend towards the level of the last Swing High or Swing Low. The trend may weaken with hidden divergence, but this has not been completed yet. As shown below, the market pulled back, probably due to profit-taking and looks to resume the downtrend.
In the TDI Pro, hidden divergence is shown as follows:
- Bearish Hidden Divergence – Green widely Dashed Line
- Bullish Hidden Divergence – Purple widely Dashed Line
NOTE: Divergence Lines appear at the bar's opening following a confirmed divergence.
This is a quick note of caution when trading with Divergence. Be aware that the market may not move in the direction of a Divergence signal. It is essential to understand that Divergence indicates a potential change or continuation in market direction. It is necessary to monitor the price movement to confirm market direction. Also, make note of the overall direction of the TDI Pro. If the Green and Red lines are below a falling Yellow line, there exists the possibility that the price will continue to move lower. The opposite is true when the Green and Red lines are above a rising Yellow line; there is a chance for the price to increase.
Look at the chart below. The TDI Pro shows hidden bullish and Regular Bullish divergence signals in this example. The hidden bullish divergence (dashed Blue lines) highlights a potential continuation up, which occurs for 1 to 2 bars, and the market drifts lower. Later, the Regular Bullish Divergence (solid Blue lines) highlights a reversal Long, in which the price moves up 1 bar, then rolls back down, continuing to show a slight downward trend.
Trend and Sentiment
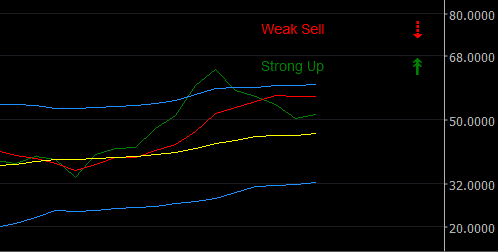
The Trend Display algorithm deciphers current market conditions measured by the TDI Pro and provides traders with a “quick read” of the market at a glance.
The Trend Display is divided into Trend Sentiment and Trade Sentiment.
Trend Sentiment – measures the overall market trend sentiment and displays one of the following:
- Strong/Weak Up Trend
- Strong/Weak Down Trend
- Consolidation
Trade Sentiment – measures the current market sentiment and displays one of the following:
- Solid/Medium/Weak Buy
- Solid/Medium/Weak Sell
- Caution – Overbought / Caution – Oversold (Extreme levels > 80 and < 20)
The Trend Sentiment and the Trade Sentiment are placed together and shown below in the Upper Right Corner of the TDI Pro indicator window.
Trade sentiment now includes a Range display, informing the user that the currency pair is in range conditions.
Signals Display
In the indicator menu, you can refine the selection of any signal category you want. Furthermore, you can refine the signals with the "Show only stronger signals" option. Some signals will be filtered out depending on the position and crossing angles of the indicator's lines. Needless to say, a more robust signal does not mean that it will be profitable. It is just a "clear" signal.
Telegram Alerts
Given that you have a bot and a channel set up in Telegram, the TDI Pro indicator will send you messages for confirmed signals on the currency pair that you run it onto. Remember that you will get signals only for the ones you selected "Yes" for display.
IMPORTANT: Please ensure your Time Zone is correctly adjusted to your local time (bottom right corner of the application).
How to Setup Telegram?
If you do not have a Telegram account, your first step is to create one and visit the Telegram Home page.
Once you have your shiny new Telegram account, you must know how to get your Bot Token and Chat ID. This robot uses these to send pictures to your Telegram Bot.
Desktop Alerts
If you select Yes, the TDI Pro indicator will push a message box notification on confirmed signals on your desktop.
Email Alerts
For this functionality to work, you must first configure your NinjaTrader settings to be able to send emails.
If you select Yes, the TDI Pro indicator will email you with confirmed signals to your entered address.
How to Install
The easiest way to learn how to install indicators (Add-Ons) is to visit the Support Hub.

NinjaScript Coding
Contact our development team if you have an idea for an automated trading strategy or a custom technical indicator.
Any Questions?
If you have questions regarding this product, contact our support team.


