Indicator Overview
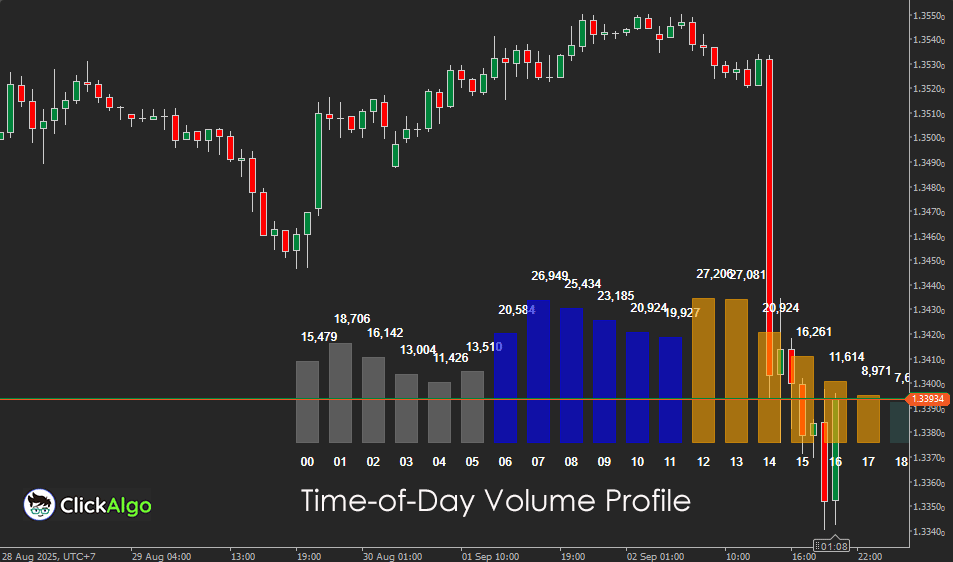
The Time-of-Day Volume Profile is a visual tool that plots intraday trading activity by hour across a chosen lookback period. It displays bars or shaded areas that correspond to the amount of volume traded at each hour, scaled against the maximum volume observed. This helps traders quickly see which times of day typically offer the strongest participation or the quietest conditions.
Background & History
Volume profile analysis has long been a part of market microstructure studies, where traders and analysts attempt to uncover patterns in how markets distribute activity. Traditional volume profiles focus on price levels, but time-based volume studies have grown in popularity as electronic trading has revealed distinct cycles of activity tied to global trading sessions. The Time-of-Day Volume Profile adapts these ideas for modern traders, offering a simple view of when liquidity concentrates during the day.
How the Indicator Works
The indicator scans intraday price bars within a chosen lookback period and accumulates the tick volume for each hour. It then plots a visual bar for each hour between the selected start and end times.
-
When the average volume mode is enabled, the indicator divides totals by the number of days analysed.
-
When heatmap mode is active, hours with higher volume are shaded more strongly.
-
When session colouring is enabled, each part of the day is given a distinct colour for clarity.
Labels can also be shown to display both the hour and the actual volume value.
The result is a profile along the chart that highlights peak liquidity hours, quieter zones, and how the distribution changes over different sessions.
Key Features
The Time-of-Day Volume Profile comes with a set of flexible features that make it easy to adapt to any market condition or trading style. It is designed for traders who want to understand liquidity cycles and customise how information is displayed on their charts.
-
Custom start and end hours to focus only on relevant market sessions.
-
Average, heatmap, and session colouring modes for different analysis styles.
-
Volume labels for both time and values.
-
Adjustable opacity and bar widths to suit chart preferences.
How to Use it for Trading (at a glance)
Traders can use the Time-of-Day Volume Profile to align their strategies with periods of liquidity. The indicator does not directly generate buy or sell signals, but instead highlights the times of day when trading conditions are more favourable.
-
Hours with high volume often coincide with overlaps between major trading sessions, such as London–New York or Tokyo–London. During these times, spreads are tighter, volatility is more consistent, and breakouts tend to carry more weight. Traders looking for trend-following opportunities can benefit from focusing their entries here.
-
Hours with low volume usually occur during quiet periods like the transition between New York close and Tokyo open. In these conditions, markets can be erratic, with sudden spikes that do not follow through. New traders should avoid entering positions at these times, as signals are less reliable.
-
Beginners can start by tracking which hours consistently produce the strongest volume for their chosen instrument. For example, EURUSD tends to be most active during the London and New York sessions, while AUDJPY is more active during Asian hours.
-
Intermediate and advanced traders can use the indicator alongside trend tools such as moving averages, RSI, or MACD. If a breakout setup appears during a high-volume hour, the probability of a strong move is greater.
-
For risk management, the indicator helps determine when to size positions more confidently. Entering trades when volume is highest reduces slippage and improves execution, especially for larger orders.
In practice, the Time-of-Day Volume Profile works best as a timing filter. It won’t tell you the direction to trade, but it shows you when the market is most liquid, giving your strategies a better chance of success.
Inputs & Parameters
The indicator provides flexible settings so traders can adapt it to different instruments or sessions.
| Parameter |
Default/Type |
Description |
| Start Hour |
0 |
The first hour of the day should be included in the analysis. |
| End Hour |
23 |
The last hour of the day should be included in the analysis. |
| Lookback Days |
5 |
Number of past days used to calculate the volume profile. |
| Bar Width (Bars) |
2 |
Width of the volume bars displayed on the chart. |
| Start Offset (Bars) |
50 |
Number of bars to offset the profile from the latest price action. |
| Line Color |
DodgerBlue |
Base colour for drawing the bars. |
| Text Color |
White |
Colour of the hour and volume labels. |
| Fill Opacity |
150 |
Transparency level of the filled bars (0–255). |
| Use Heatmap |
False |
Enables dynamic shading where higher volumes are darker. |
| Use Average Volume |
False |
Shows average volume per hour rather than totals. |
| Use Session Colouring |
False |
Assigns different colours to global sessions (Asia, Europe, US). |
| Show Volume Labels |
True |
Displays both the hour and volume values on the chart. |
Formula
The Time-of-Day Volume Profile aggregates tick volume by the opening hour of each bar over a defined lookback period. The simplified process is:
Pipeline: Price bars → Group bars by hour of day → Sum tick volumes for each hour → Optionally divide by lookback days → Scale volumes to chart range → Plot rectangles with optional heatmap or session colouring.
Hourly Aggregation. HourlyVolume[h] = Σ TickVolume of all bars where OpenTime.Hour = h, across LookbackDays.
Average Mode. AverageHourlyVolume[h] = HourlyVolume[h] ÷ LookbackDays.
Scaling. ScaledHeight[h] = (Volume[h] ÷ MaxVolume) × PriceRange.
Color Mapping. Heatmap intensity ∝ Volume[h] ÷ MaxVolume. Session colouring assigns fixed colours by time zone.
Chart Display. Draw rectangle for each hour with height = ScaledHeight[h]. Add labels for hour and volume if enabled.
| Symbol |
Meaning |
| HourlyVolume[h] |
Total tick volume during hour h across the lookback period. |
| AverageHourlyVolume[h] |
Hourly volume averaged over LookbackDays (if enabled). |
| MaxVolume |
The highest volume of any hour within the analysed period. |
| PriceRange |
Difference between recent high and low used to scale volumes visually. |
| ScaledHeight[h] |
Chart bar height for hour h proportional to its volume share. |
| Heatmap |
Optional mode where bar opacity increases with relative volume. |
| Session Coloring |
Optional fixed colour mapping by global session (Asia, Europe, US). |
| LookbackDays |
Number of days used in the volume aggregation. |
Advantages
The Time-of-Day Volume Profile makes it easy to visualise when liquidity is highest, helping traders avoid thin markets and align with institutional participation. Its flexibility through colouring and scaling ensures it can adapt to any trading style, whether scalping, intraday swing, or longer-term setups.
Disadvantages
The indicator is based purely on historical volume patterns and does not predict future market direction. It should not be used in isolation for trade entries, as low-volume or high-volume periods do not always correlate with profitable trading conditions.
How To Install & Remove
First, ensure that you have the cTrader trading platform installed. Then, unzip the file and double-click it to automatically install the platform.
Need Extra Help?
Get instant answers with cTrader Sensei — our free AI assistant built for the cTrader platform. It can explain the indicator settings, suggest trading strategies, and guide you step-by-step through the use of this indicator. Rated 4.9 out of 5 in the ChatGPT Store.
Chat with cTrader Sensei
Prefer human help? Visit our support forum where our team and community can assist you.
Note: cTrader Sensei runs on OpenAI's ChatGPT platform. To use it, you will be asked to create a free OpenAI account. Registration is quick and costs nothing.
The free version works immediately, but upgrading to a ChatGPT Plus subscription unlocks the latest GPT model, which provides more accurate and detailed answers for trading, coding, and product support.
Need a Broker
If you're still looking for a broker with tight spreads and fast execution, visit our top cTrader broker site.


