Indicator Overview
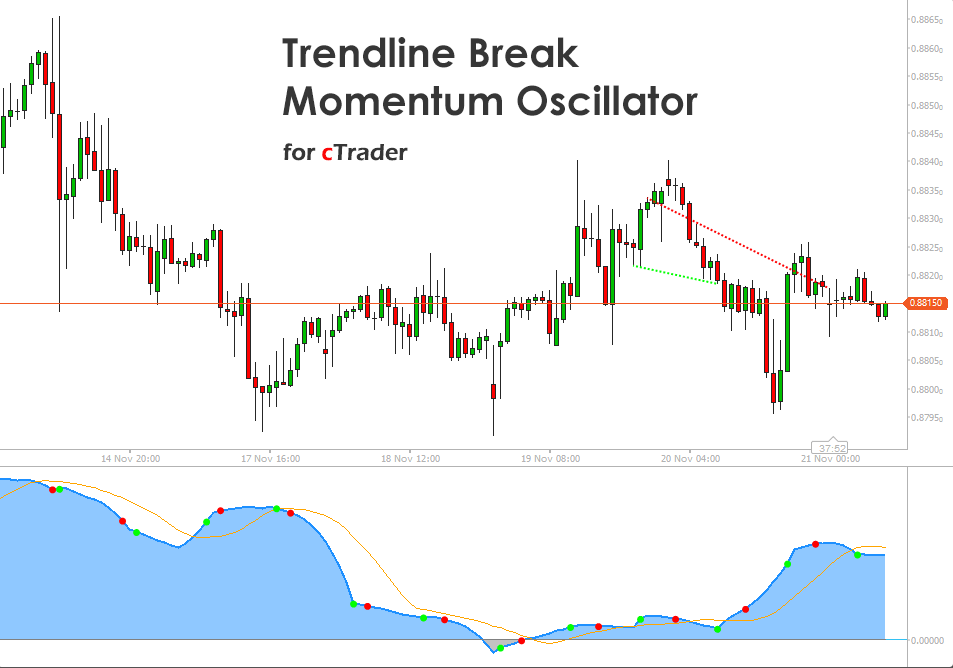
This oscillator is built around a simple idea: the distance from bullish and bearish breakouts reveals the direction and strength of momentum. The indicator tracks how far the price has moved beyond bullish and bearish trendline breaks, applies synthetic EMAs to normalise these distances, and then plots the delta as a centred oscillator. Breakout dots highlight fresh momentum impulses, while slope direction shows whether the current move is accelerating or slowing. A signal line adds clarity for crossovers and timing, and optional divergence detection provides early warnings of exhaustion. The indicator provides a clear view of structural shifts and helps traders judge whether a trend is strengthening, weakening, or poised to reverse.
i
This tool delivers fast structural insight through dual alpha smoothing, clear breakout dots, divergence detection and optional price trendlines, giving traders immediate visibility into momentum shifts and reversal pressure. It highlights significant break events, filters noise effectively and provides a clean signal line for precise timing, making it a sharp and dependable addition to any momentum-based trading approach.
Background & History
Trendline breakouts have been used for decades as a core method to understand crowd psychology and directional conviction. Traditional chartists manually plot descending and ascending lines to detect when momentum breaks its boundaries. This oscillator modernises the idea by quantifying breakout behaviour and turning it into a continuous, data-driven momentum curve. Inspired by our original Trendlines with Breaks indicator, this build takes the concept further by analysing distance, smoothing it mathematically, and creating a dynamic oscillator that reacts to structural changes. It blends classical technical analysis with quantitative breakout logic, making it suitable for both discretionary traders and systematic strategies.
How the Indicator Works
The oscillator measures the maximum distance between bullish and bearish breaks, applies short- and long-term alpha smoothing, and calculates the difference. The result rises when bullish strength dominates and falls when bearish pressure increases. Breakout dots appear when price moves beyond recent highs or lows, and cooldown logic prevents clustering—divergence detection flags when price and momentum disagree. Optional trendlines are drawn using oscillator swing points.
-
Price highs drive bullish break distance.
-
Price lows drive bearish break distance.
-
The dual alpha engine smooths both independently.
-
The oscillator = bullish alpha minus bearish alpha.
-
Breakout dots appear when highs or lows exceed previous levels.
-
Divergence dots appear when momentum contradicts price movement.
-
Trendlines use oscillator swing highs and swing lows.
Key Features
This tool transforms structural breakout behaviour into a refined, easy-to-read oscillator. Traders benefit from clear dots for breakout moments, optional divergence, slope direction and flexible smoothing.
-
Momentum oscillator driven by structural break distance.
-
Breakout dots and divergence markers.
-
Optional price trendline drawing using oscillator swing points.
-
Signal line for timing entries and exits.
-
Flexible smoothing settings for both short and long-term trading styles.
How to Use it for Trading
This oscillator helps traders identify when momentum changes, when breakouts carry strength, and when reversals may be forming. A rising oscillator shows strengthening bullish conviction, while a falling line signals building bearish pressure. Crossovers with the signal line help time entries during momentum shifts. Divergence warns that price does not match momentum, which often appears before a reversal. Traders can combine this tool with support, resistance, and volume to validate high-probability setups.
To apply it in practice:
-
Watch for a bullish crossover above the signal line to support long setups.
-
Watch for a bearish crossover below the signal line to support short setups.
-
Use divergence as an early warning of fading momentum.
-
Align trendline breakouts with oscillator direction for confirmation.
-
Beginners can start by noting how the oscillator behaves during major price swings.
Quick steps:
-
Identify slope direction.
-
Confirm breakout dots.
-
Note signal-line crossovers.
-
Look for divergence.
-
Check alignment with your trend or risk management rules.
Complimentary Indicators
The following tools support a more complete analysis when used together with this oscillator.
-
Supply and Demand Zone Indicators.
-
Market Structure Oscillators.
-
Volume Heatmap Overlay.
-
Smart Support and Resistance.
-
Session Flow Visualisers.
Inputs & Parameters
The indicator includes flexible settings grouped for clarity. These parameters allow traders to adjust detection sensitivity, smoothing, breakout behaviour and optional trendline drawing.
| Parameter |
Default/Type |
Description |
| Swing Detection Lookback |
20 |
Defines how far back to scan for significant swing highs and lows. |
| Breakout Cooldown Bars |
10 |
Number of bars required before another breakout dot can form. |
| Short Alpha Length |
8 |
Controls fast smoothing of the bullish break distance. |
| Long Alpha Length |
21 |
Controls the slow smoothing of bearish break distance. |
| Signal Smoothing Method |
Exponential |
Method used to smooth the signal line. |
| Signal Smoothing Length |
9 |
Length of smoothing applied to the signal line. |
| Enable Divergence |
True |
Enables or disables divergence detection. |
| Divergence Detection Length |
20 |
Number of bars used to compare price and oscillator behaviour. |
| Draw Price Trendlines |
False |
Enables trendline drawing using oscillator swing points. |
| Trendline Lookback Bars |
100 |
Defines the search range for swing-based trendlines. |
Formula Explanation
The oscillator is formed by measuring bullish and bearish break distances, smoothing them separately, and subtracting the two to produce a centred value.
BullDist(t) = max(Highs within lookback)
BearDist(t) = min(Lows within lookback)
BullAlpha(t) = SyntheticEMA(BullDist, ShortAlpha)
BearAlpha(t) = SyntheticEMA(BearDist, LongAlpha)
Oscillator(t) = BullAlpha(t) − BearAlpha(t)
Signal(t) = Smooth(Oscillator, SignalLength)
Advantages
This tool captures structural momentum in a way that is not dependent on fixed periods. It reacts to real shifts in price behaviour and offers clear breakout confirmation. The combination of momentum, divergence and trendline logic provides strong clarity during trending and corrective phases. Its flexibility makes it suitable for various timeframes and trading styles.
Disadvantages
The oscillator is reactive and will not replace full multi factor analysis. It may produce noise during low volatility sessions and can lag heavily choppy markets. Divergence signals should not be used in isolation, and users must combine this tool with their existing trend and risk management rules for reliable outcomes.
How To Install & Remove
First, ensure the cTrader trading platform is installed. Then unzip the file and double-click it to install automatically.
Need Extra Help?
Get instant answers with cTrader Sensei — our free AI assistant built for the cTrader platform. It can explain the indicator settings, suggest trading strategies, and guide you step-by-step in using this indicator. Rated 4.9 out of 5 in the ChatGPT Store.
Chat with cTrader Sensei.
Prefer human help? Visit our support forum where our team and community can assist you.


