Indicator Overview
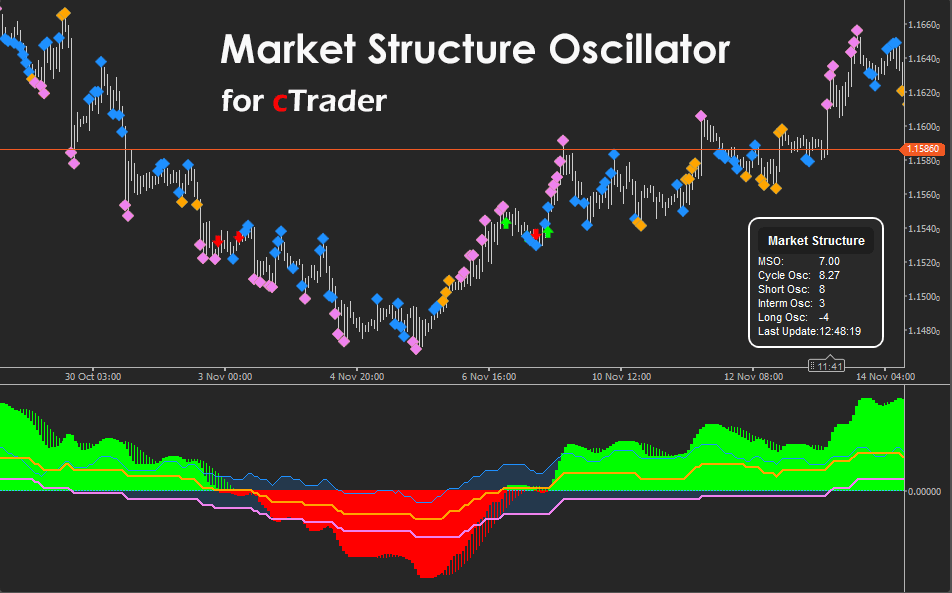
This indicator transforms price action into a clear structural representation that shows how market behaviour evolves across multiple time horizons. It detects swing highs and lows, identifies market structure shifts, measures structural momentum, and blends these elements into a responsive oscillator that presents a real-time snapshot of buying and selling strength. The inclusion of cloud shading, colour gradients, and optional cycle analysis produces an intuitive visual layout that highlights both early reversals and confirmed continuation signals. By smoothing the raw structural data, the oscillator reduces noise while keeping key movements visible, offering traders a more organised perspective of market rhythm. It is designed to simplify complex structure analysis and guide users toward stronger timing, clearer trend interpretation, and improved trade decision quality.
i
-
Multi-timeframe structural analysis processed into a unified oscillator.
-
Cloud shading that highlights short and long-term structural divergence.
-
Cycle oscillator providing additional timing for trend and counter-trend opportunities.
-
Equilibrium cross signals that alert traders to important structural transitions.
-
Fully customisable behaviour with weighting, smoothing, colours, and visualisation controls.
Background & History
Market structure analysis originated from classical price action concepts, often involving discretionary interpretation of swing points and break levels. Modern trading has encouraged a greater reliance on quantitative approaches, using algorithms to objectively and consistently identify structural shifts. Oscillators derived from swing states emerged as a way to visualise the balance of structural pressure between buyers and sellers across different time horizons. The Market Structure Oscillator follows this progression by merging traditional structure recognition with multi-timeframe logic and smoothing techniques to create a cleaner representation of underlying momentum. It builds upon long-standing principles of swing identification, break of structure analysis, and cycle measurement, combining them into a single indicator that offers structure-oriented signals without subjective bias.
How the Indicator Works
The indicator begins by detecting swing highs and lows at three distinct lookback levels, representing short, intermediate, and long-term structural movements. These swing classifications are then converted into state values that accumulate upward or downward based on whether the structure is forming higher or lower levels. These accumulated states form the basis of the oscillator, with each timeframe weighted individually to reflect the desired balance between fast and slow structure.
A smoothing process is applied to remove noise and produce a clean final output. The oscillator is coloured using gradient tones based on its position relative to equilibrium, and optional signals appear when the oscillator crosses this level. A separate cycle oscillator computes structural momentum across a rolling window, offering additional timing insight. When enabled, the indicator also plots swing-based market structures directly on the chart for visual confirmation of the underlying analysis.
Key Features
The indicator offers a broad set of tools that enhance structure-based trading, providing deeper insight into trend shifts, breakouts, and momentum cycles. Its modular design supports both simple and advanced trading styles while maintaining clear visual interpretation.
-
Multi-timeframe swing detection with smoothed oscillator output.
-
Cycle oscillator providing cycle-based confirmation.
-
Bullish and bearish gradient colouring for clear momentum visibility.
-
Equilibrium signals marking structural transition points.
-
Optional chart drawings that show detected swing structures.
-
Independent oscillators for deeper multi-timeframe analysis.
How to Use it for Trading
Traders can use the oscillator to determine when market structure is shifting in favour of buyers or sellers and to confirm emerging trends or developing reversals. When the oscillator rises above equilibrium, it suggests a strengthening bullish structure, while a move below equilibrium suggests a strengthening bearish environment. The cycle oscillator adds extra timing precision, particularly during transitions when trend momentum begins to accelerate or slow. Combining this with chart-based market structure detection supports clear entry selection. Beginners can start by watching equilibrium crosses before incorporating multi-timeframe logic and cycle signals into their decision-making. More advanced users can combine the indicator with trend filters and risk management plans to refine entries and manage trade exposure.
Quick steps for practical use
-
Watch the equilibrium line for bullish or bearish transitions.
-
Confirm direction using the slope and colour of the oscillator.
-
Use cycle oscillations to refine timing during reversals.
-
Refer to swing markers on the chart for structural confirmation.
-
Combine with trend indicators and sensible risk management.
Complimentary Indicators
Using this indicator with additional trend and momentum confirmations can improve accuracy and reduce false signals. These tools help validate structural transitions and provide independent confirmation.
-
cTrader Trend Strength Indicator.
-
cTrader Volume Weighted Support and Resistance Indicator.
-
cTrader Supply and Demand Zones Indicator.
-
cTrader Adaptive Moving Average Indicator.
-
cTrader Cycle Trend Indicator.
Inputs & Parameters
Below are all user-adjustable settings that influence the indicator’s behaviour. These parameters allow full control over weighting, smoothing, colour schemes, alerts, cycle logic, and structural visualisation.
| Parameter |
Default/Type |
Description |
| Short Term Weight |
1.0 |
Influence of short term structural momentum on the main oscillator. |
| Intermediate Term Weight |
1.0 |
Influence of intermediate structure on the final oscillator value. |
| Long Term Weight |
1.0 |
Controls the effect of long term structure on market momentum. |
| Oscillator Smoothing |
3 |
Smooths the oscillator to reduce noise and provide a cleaner signal. |
| Gradient Bull Color |
Lime |
The colour used for bullish momentum readings. |
| Gradient Bear Color |
Red |
The colour used for bearish momentum readings. |
| Equilibrium Cross Signals |
true |
Displays arrows when the oscillator crosses equilibrium. |
| Show Cycle Oscillator Histogram |
true |
Shows or hides the cycle oscillator below the main oscillator. |
| Cycle Signal Length |
10 |
Defines the period used to calculate the cycle oscillator. |
| Cycle Cross Signals |
true |
Shows arrows when the cycle oscillator crosses equilibrium. |
| Show Market Structures on Chart |
true |
Enables the display of swing based market structures on the price chart. |
| Short-Term Swing Lookback |
5 |
Defines the lookback bars for short term swing detection. |
| Intermediate-Term Swing Lookback |
15 |
Defines the lookback bars for intermediate swings. |
| Long-Term Swing Lookback |
40 |
Defines the lookback bars for long term swing detection. |
| Independent Oscillators |
true |
Shows separate oscillators for short, intermediate, and long term structure. |
| Short Oscillator Color |
DodgerBlue |
Colour used for the short term oscillator. |
| Intermediate Oscillator Color |
Orange |
Colour used for the intermediate oscillator. |
| Long Oscillator Color |
Violet |
Colour used for the long term oscillator. |
Formula Explanation
The Market Structure Oscillator combines structural states from short, intermediate, and long-term swings into a weighted momentum value. This value is smoothed to produce the final oscillator reading. Below is the simplified formula representing the core calculation.
MSO_raw = (Short_State × Short_Term_Weight)
(Intermediate_State × Intermediate_Term_Weight) (Long_State × Long_Term_Weight)
MSO = SMA(MSO_raw, Smoothing_Period)
Advantages
This indicator provides a structured and objective method for analysing momentum across several time horizons at once. It simplifies complex price action into a readable oscillator and reduces noise through smoothing while maintaining sensitivity to structural change. Its colour gradients and signals support faster interpretation and help traders build confidence in the trend direction.
Disadvantages
The indicator requires some familiarity with market structure concepts and may appear complex to complete beginners. Its multi timeframe nature means parameters should be tuned carefully depending on the trading style and timeframe. Excessive customisation can create confusion if the user is not consistent with settings.
How To Install & Remove
First, ensure the cTrader trading platform is installed. Then unzip the file and double-click it to install automatically.
Need Extra Help?
Get instant answers with cTrader Sensei — our free AI assistant built for the cTrader platform. It can explain the indicator settings, suggest trading strategies, and guide you step-by-step in using this indicator. Rated 4.9 out of 5 in the ChatGPT Store.
Chat with cTrader Sensei.
Prefer human help? Visit our support forum where our team and community can assist you.


