History & Background
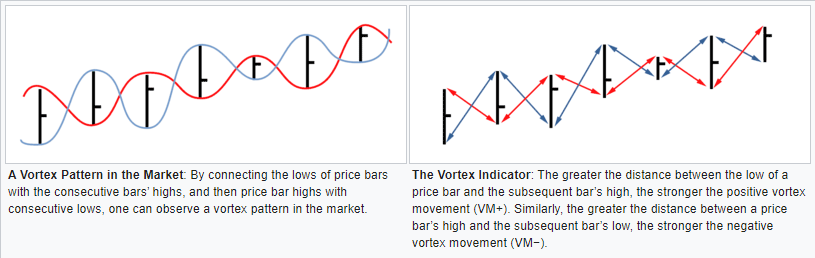
Created in 2010 by Etienne Botes and Douglas Siepman, the Vortex concept borrows from the physics of vortices to capture directional energy in markets. The design offers a clean two-line read of trend strength and direction, similar in spirit to ADX, but more visual and immediate. Unlike oscillators such as RSI or Stochastic, which focus on momentum extremes, the Vortex is closer in spirit to tools like ADX, providing confirmation of trend strength and direction rather than overbought or oversold levels.
How the Indicator Works
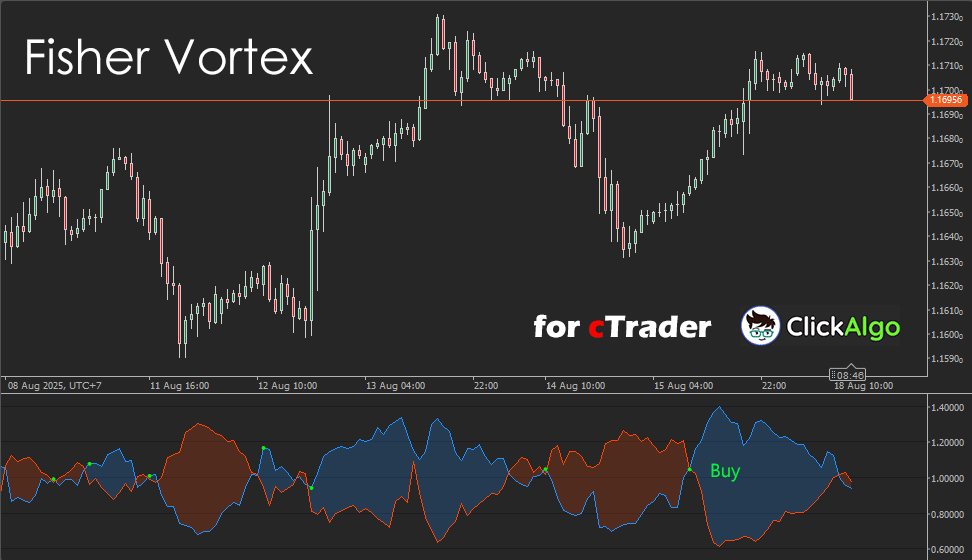
Directional movement is computed from the relationship between the current bar’s extremes and the previous bar’s extremes, then normalised by true range and summed over a rolling period. The Plus line rising above the Minus line indicates buyers are in control; the opposite implies sellers dominate. This build plots a lime dot on the bar where a bullish crossover occurs, and fills the space between lines with a soft cloud to make regimes obvious at a glance.
Formula
The equations below define the exact calculations used in this cTrader Vortex Indicator build. They follow the standard method, using period-based rolling sums and a clear bullish crossover signal that plots a point on the bar where the regime flips.
True Range, per bar
TRt = max( Hight − Lowt, |Hight − Closet−1|, |Lowt − Closet−1| )
Directional vortex movement, per bar
VM+t = |Hight − Lowt−1|, VM−t = |Lowt − Hight−1|
Rolling sums over period P
sumTRt = Σi=t−P+1t TRi
sumVM+t = Σi=t−P+1t VM+i
sumVM−t = Σi=t−P+1t VM−i
Vortex lines
VI+t = sumVM+t ÷ sumTRt, VI−t = sumVM−t ÷ sumTRt
Bullish crossover signal
Signalt = VI+t if VI+t > VI−t and VI+t−1 ≤ VI−t−1, otherwise no plot.
How to Use it for Trading
The Vortex Indicator for cTrader is best used as a trend confirmation and entry timing tool rather than a stand-alone strategy. Traders watch for crossovers of the Plus and Minus lines, combined with the lime signal dots, to spot fresh trend momentum.
-
Bullish setups: When the Plus line (blue) crosses above the Minus line (red), a lime dot plots on the bar of the crossover, marking the start of a potential uptrend.
-
Bearish setups: When the Minus line moves above the Plus line, sellers are in control. While this version doesn’t plot a bearish dot, the crossover is visible on the cloud shift.
-
Exits and risk control: A crossover against your position acts as an early warning to tighten stops or close trades. A narrowing gap between the two lines can indicate consolidation or weakening trend strength.
-
Multi-timeframe confirmation: Use higher timeframe Vortex signals for market bias, then time entries on lower timeframes to reduce false signals.
This makes the indicator especially effective when combined with filters like moving averages, ATR stops, or support and resistance analysis.
Input Parameters
| Parameter |
Default / Type |
Description |
| Inputs |
| Period |
14 (int) |
Look back for summing True Range and directional movement. Lower values are faster, and higher values are smoother. |
Advantages
The Vortex Indicator provides a simple yet powerful way to identify and confirm trends. The Plus and Minus lines, combined with the shaded cloud, give traders a quick visual read of which side is in control, while the lime crossover signals mark fresh momentum shifts with precision. It is lightweight, efficient for live use, and adaptable to any symbol or timeframe, from Forex and indices to cryptocurrencies. Its clarity makes it useful both as a confirmation tool and as part of a broader trend-following strategy.
Disadvantages
Despite its strengths, the Vortex Indicator is not without limitations. Like most crossover-based tools, it can produce false signals during sideways or choppy markets where price lacks clear direction. Traders relying solely on its signals may experience whipsaws or premature entries. To improve reliability, it is best used in conjunction with other filters such as moving averages, ATR stops, or higher timeframe analysis, which help separate true momentum shifts from market noise.
Conclusion and Compatibility
This cTrader Vortex Indicator is a practical way to spot trend initiations and continuations, with an immediate visual read and explicit crossover markers. It is compatible with all cTrader symbols and timeframes. Common starting points are Period 14 for Forex and indices, 21 to 28 for noisier crypto pairs, and 10 to 14 for intraday work.
How To Install & Remove
First, ensure that you have the cTrader trading platform installed. Then, unzip the file and double-click it to install the platform automatically.
Help Using This Indicator
If you need help using this indicator, try asking cTrader Sensei, our free AI assistant dedicated to the cTrader platform, rated 4.9 out of 5 in the ChatGPT Store. It can guide you through setup, usage, and troubleshooting with clear, step-by-step support.
If you still need assistance, feel free to post your question on our product support forum, where our team and community can help.
Need a Broker
If you're still looking for a broker with tight spreads and fast execution, visit our top cTrader broker site.


