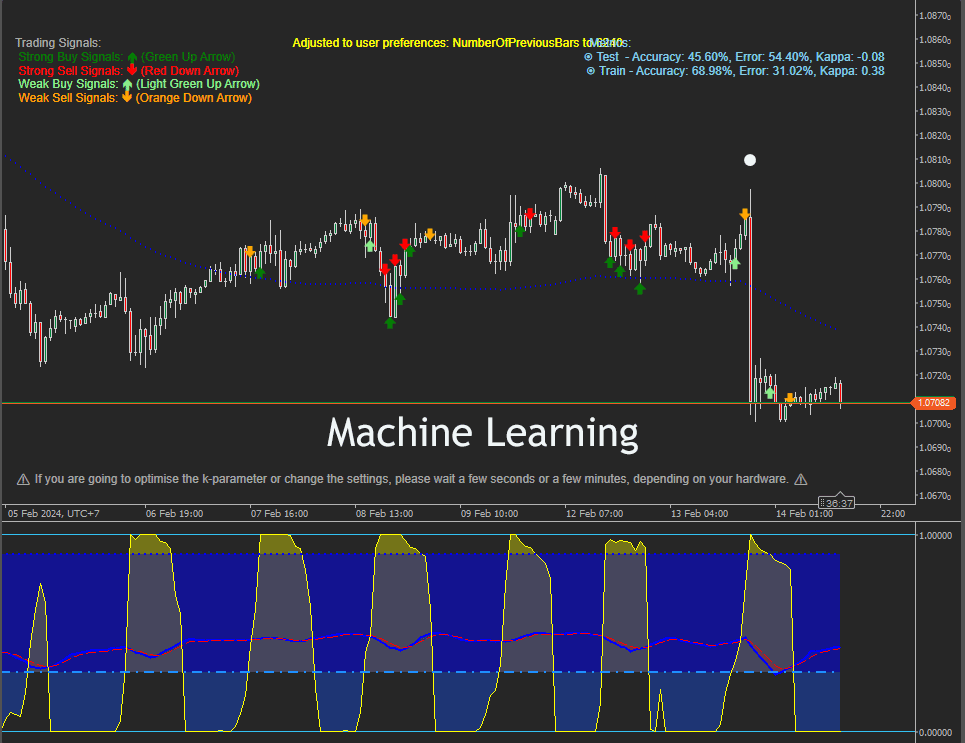
Elevate Your Trading to Mastery with Machine Learning Precision
By combining advanced technical indicators and state-of-the-art machine learning techniques, the ML k-NN J. Welles Wilder Indicator is engineered to empower traders with actionable signals rooted in real-time market conditions and historical data.
Machine learning indicators are still in their infancy, they are not mature enough to be highly accurate in the financial markets.

- Click to Start: Activate the pulse of machine learning.
- Tailor-Made Experience: Personalize parameters to fit your trading style like a glove.
- Data Intelligence: A meticulous compilation of historical data awaits to arm you with knowledge.
- Proactive Analysis: Anticipate market movements with indicators that think ahead.
- Precision-Driven Predictions: Let the k-NN model be your crystal ball in the market.
- Signal Clarity: Filter through the market’s whispers for signals that speak volumes.
The Future of Trading
Why follow when you can lead? The ML k-NN J. Welles Wilder Indicator isn't just another tool; it's a revolution at your fingertips. Define the rhythm of the markets and enjoy the symphony of success.
Understanding the Strategy Implementation
In the Calculate function of the ML k-NN J. Welles Wilder Indicator, we'll delve into how the strategy is meticulously crafted using key indicators to generate precise trading signals:
📊 MACD and MACD Signal Line
- 💹 MACD (Moving Average Convergence Divergence): This powerful indicator reveals market momentum.
- 📈 Calculation: We compute the MACD line and the signal line to pinpoint potential buy and sell signals.
📈 Normalized Average True Range (NATR)
- 📉 NATR: A volatility gauge aiding in setting optimal stop-loss and take-profit levels.
📊 Zero Lag Welles Wilder Moving Average (WMA)
- 📉 Zero Lag WMA: Identifying market trends with precision.
- 🔄 Procedure: We calculate the value and ensure its validity before the chart presentation.
📈 Threshold Lines
- 🚦 Thresholds for ATR (Average True Range): Essential for defining risk levels effectively.
📊 Feature Extraction
- 📈 We extract a plethora of market features, including RSI, ATR, ADX, ADXR, DI Minus, DI Plus, Parabolic SAR, WMA50, WMA100, WMA200, MACD Histogram, and CMF.
- 🔍 These features serve as critical inputs for our cutting-edge machine-learning model.
📈 Trading Signals
- 🚀 The ML k-NN model leverages the extracted features to generate trading signals.
- 🚥 These signals are thoughtfully categorized into Strong Buy, Strong Sell, Weak Buy, and Weak Sell, each represented by distinctive chart arrows.

Customization Unleashed
- Personal Market Historian: Analyze past market data with adjustable depth.
- Learning Curve Control: Balance your model's learning with real-time market agility.
- Strategic Window Adjustment: Capture the market's beat with a customized time perspective.
- Neighbourly Advice: Calibrate the k-NN algorithm's sensitivity to fit your risk profile.
🔍 Precision-Tuned for the Connoisseur:
- Distance Metrics Decoded: From Euclidean to Minkowski, tailor your analytical lens.
- Signal Customization: Configure your alerts to match your market philosophy.
🌟 Exclusively for the Elite Trader:
This isn't just a tool; it's the key to unlock your potential. Be the maestro of your trading destiny, conducting your strategies with precision, adaptability, and finesse.
🛠️ Tailored to Your Trading Blueprint:
- One-on-One Setup: Customize your indicator with our personal setup consultations.
🔍 A Transparent Craft:
- Behind-the-Scenes Insights: Understand the intricate development process for full confidence in your tool.
🔄 Commitment to Excellence:
- Continual Evolution: Regular updates ensure you're always ahead of the market curve.
🎁 Try the Excellence:
- Risk-Free Exploration: Experience the full power with a free trial period. No strings attached.
🌐 Customize Your Trading with Unmatched Precision
Dive into the heart of algorithmic trading with our ML k-NN J. Welles Wilder Indicator, where you hold the power to fine-tune every detail. Here’s how you can tailor your trading experience to the sharpest edge:
📊 Model Parameters: Craft Your Strategy
- 🔍 Number of Previous Bars: Your market memory lane. You decide the breadth of market history to be analyzed, from 2,500 to 100,000 bars. This parameter is the cornerstone of your strategic foundation, offering the flexibility to expand or narrow your historical lens as you prefer.
- 🧠 Training Ratio: The balance of wisdom. Define the proportion of historical data that trains the model's intellect, with a range from 0.01 to 0.99. A higher ratio equips the model with extensive past knowledge, while a lower ratio keeps it nimble and responsive to new trends.
- 🪟 Window Size: Your strategic viewport. Set the temporal scope for pattern recognition. This is where you can calibrate the model to be as myopic or far-sighted as your strategy demands.
- 👥 Number of Neighbors (k): Your advisory council. Determine how many data points the k-NN algorithm should consult for each prediction. It's a delicate balance; more neighbors for consensus or fewer for swift decision-making.
📏 Distance Metric:
- The fabric of your analytical universe. Choose the geometry of your trading universe with options like:
- Euclidean Distance: Measures the straight-line distance between data points in a multidimensional space.
- Manhattan Distance: Calculates the distance by summing the absolute differences between data point coordinates.
- Chebyshev Distance: Finds the maximum difference between each coordinate of two data points.
- Minkowski Distance: A generalization of both Euclidean and Manhattan distances, where you can define the power parameter for customization.
- 🔧 Optimization of (k): The pursuit of peak performance. Engage this feature to let the algorithm self-tune its 'k' value, ensuring you're always operating at the zenith of accuracy.
🚨 Signal Options: Define Your Alerts
- 📈 Strong Buy/Sell Signals: Stand out with signals that indicate significant market opportunities. These are your green and red flags waving confidently amidst market turbulence.
- 📉 Weak Buy/Sell Signals: Stay ahead of the curve with early hints of potential market shifts. These signals are the subtle nudges for the cautious or the proactive trader.
🔬 Strategy-Specific Parameters: Sharpen Your Edge
- 📉 MACD Zero Lag WWMA: Stay ahead of trend shifts with minimal delay. Capture the pulse of the market with an agility that traditional MACD lines envy.
- 🌊 Normalized ATR Strategy: Master market volatility. Steer your strategy with an ATR that dynamically adjusts to the ebb and flow of market conditions.
- 🔁 Period WWMA Zero Lag: Anticipate, don't just react. With moving averages that predict rather than follow, you're always one step ahead.
⚙️ Refined Technical Inputs:
- 📈 RSI Period: Calibrate the sensitivity of the Relative Strength Index to match your risk appetite, from fast-paced trading to a more calculated approach.
- 🔝 ADX Period: Set the window for assessing trend strength. Sharpen or smooth out the ADX to suit your strategic gaze.
- 🔄 PSAR Step and Maximum Step: Fine-tune the Parabolic SAR to align with your trading tempo, from conservative to aggressive stepping.
- 📏 WWMA Periods: Choose the periods for the Welles Wilder Moving Averages to resonate with your analytical rhythm, whether it's fast beats or slow symphonies.
- 🌪 ATR and Moving Average Methods: Select the period and style for the Average True Range and its moving average computation, crafting an indicator that moves to your strategy's beat.
Understanding Symbol Support and Timeframes
In this section, we'll dive deeper into the symbol support and timeframes of the ML k-NN J. Welles Wilder Indicator. The following tables provide a comprehensive overview of the symbols supported and their corresponding timeframes. This information is crucial for traders looking to harness the power of this innovative tool effectively.
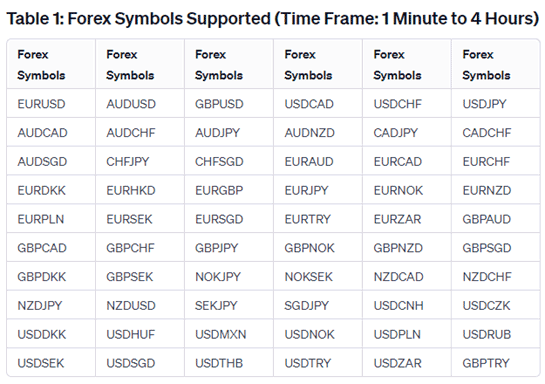
📊 Table 1: Forex Symbols Supported (Time Frame: 1 Minute to 4 Hours)
- 🌐 Explore a wide array of Forex symbols supported by the ML k-NN J. Welles Wilder Indicator.
- 🕒 Supported timeframes for Forex trading range from 1 Minute to 4 Hours.
- 💡 Traders can analyze these symbols within these timeframes to make informed decisions.

Table 2: Crypto Symbols Supported (Time Frame: 1 Minute to 1 Hour)
- 🚀 Dive into the world of cryptocurrencies with support for popular crypto symbols.
- ⏱️ Supported timeframes for crypto trading extend from 1 Minute to 1 Hour.
🌟 Unlock opportunities for precise analysis in the dynamic crypto market.

💰 Table 3: Metal Symbols Supported (Time Frame: 1 Minute to 4 Hours)
- 🔒 Delve into precious metals with support for various metal symbols.
- 📉 Supported timeframes for metals analysis span from 1 Minute to 4 Hours.
🪙 Empower your trading strategy with insights into precious metals markets

Each of these tables illustrates the extensive coverage of symbols and timeframes, allowing traders to tailor their strategies to their preferences. Whether you're a Forex, cryptocurrency, or metal trader, this tool equips you with the data you need to make precise decisions. By understanding the symbols and timeframes supported by the ML k-NN J. Welles Wilder Indicator, you can effectively utilize this revolutionary tool to elevate your trading experience and achieve trading mastery.
How To Install & Remove
First, make sure you have the cTrader trading platform installed, unzip the file and double-click on it to automatically install it onto the platform. The file that is installed can be found in your indicators folder.
Any Questions?
If you have any questions, please first search our product help forum for the answer, if you cannot find it, post a new question.
Need a Broker
If you are still looking for a broker you can trust, take a look at our best cTrader broker site.


