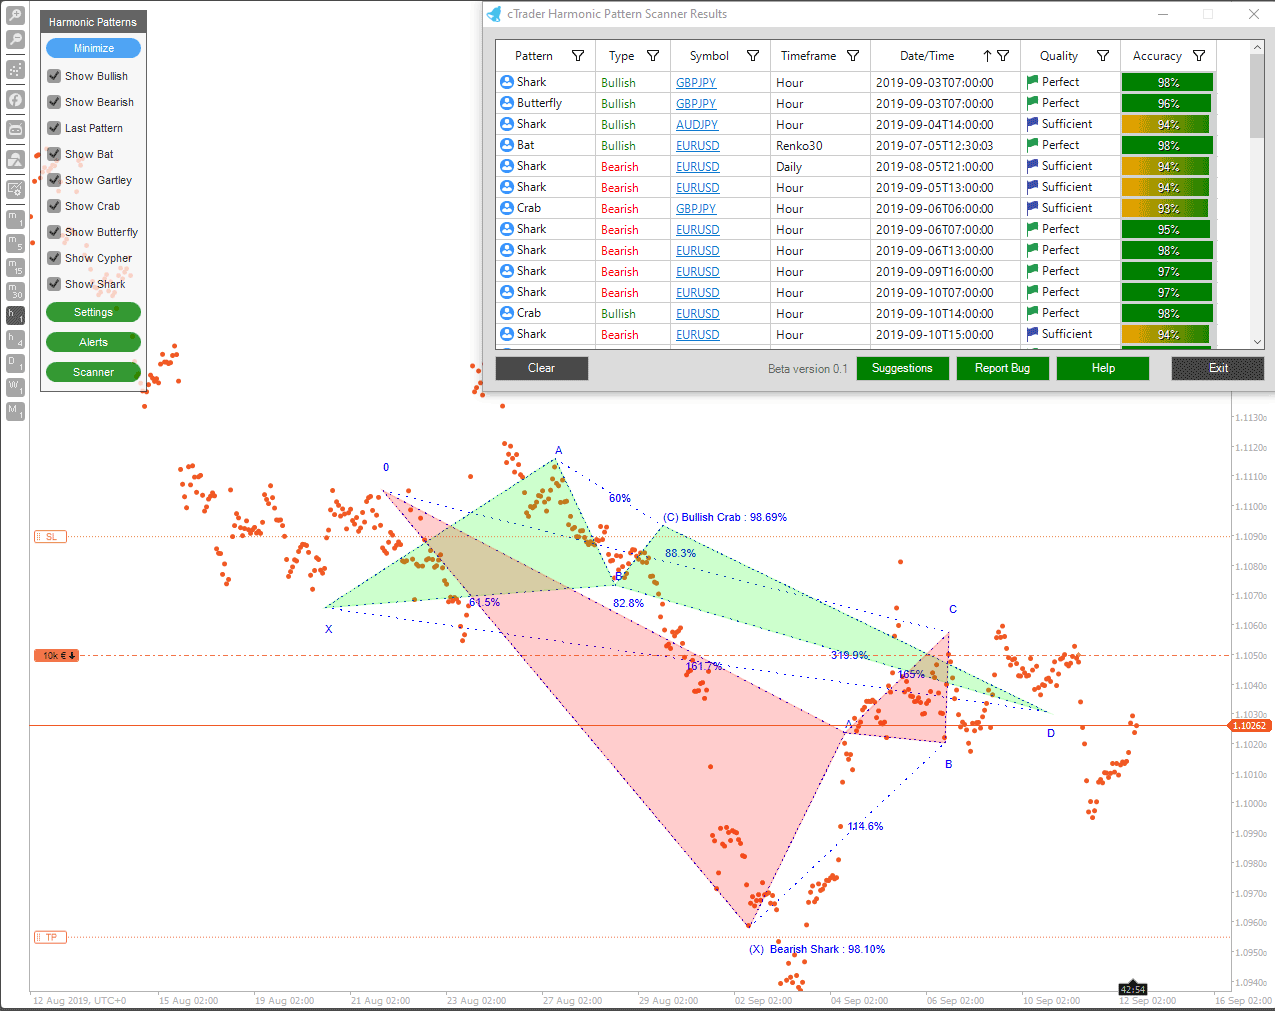
Our cTrader Harmonic price pattern detector will take geometric price patterns to the next level by using Fibonacci numbers to define precise turning points and unlike other common trading methods, this indicator will help to predict future movements and send instant messages to the trader when a pattern is formed.
"Harmonics is the process of identifying the market's rhythm or its pulse, and then exploiting its trading opportunities"
About Fibonacci Numbers & Geometry
You will find that harmonic trading couples patterns and mathematics into a trading method that is well-defined and based on the assumption that all patterns will repeat themselves. At the heart of the methodology is the initial ratio which can be a derivative of 0.618 or 1.618.
Other ratios that can be used include 0.382, 0.50, 1.41, 2.0, 2.24, 2.618, 3.14 and 3.618. The principal ratio is found all around us in our everyday lives and it is also found in almost all man-made structures. Since the pattern will repeat itself throughout nature, the ratio is also seen in the financial markets.

This harmonic indicator will find patterns of different lengths and dimensions, we use Fibonacci ratios on the patterns and try to predict the future movements. This type of trading system is mainly credited to Scott Carney which is analogous to the predictable behaviour of many of life's natural processes, harmonic patterns measures similar relationships within the financial markets to define profitable opportunities in an unprecedented manner. These strategies are entirely new to the trading community, and they represent a profound advancement beyond all other Fibonacci methodologies.
What Patterns Are Included?
This indicator will draw onto the chart when any one of the following patterns are formed, click on any of the links below for more information.
- Butterfly a.k.a Gartley butterfly patterns
- Crab - The harmonic Crab is an extreme harmonic pattern which means price action will typically be volatile.
- Gartley - Very popular, it is a retracement and continuation pattern that occurs when a trend temporarily reverses direct.
- Cypher - This is a is a four-leg reversal pattern and the pattern follows a specific Fibonacci ratio.
- Shark - This is a combination of a 'failed' wave, an extreme harmonic impulse wave and the famous 0.886 retracements.
- Bat - This is made up of 5 swing points, X, A, B, C and D and come in Bullish and Bearish bat variations.
Instant Alerts
To make this indicator even more useful you can receive an alert when a pattern has formed, this is useful if you are looking at other charts or even away from your PC. The following alerts include a Popup window, Email alert, Telegram instant message alert and an SMS text message alert.
Chart Types & Timeframes
This indicator will work with all chart types and timeframes: Bar Chart, Candlestick Chart, Line Chart, Dots Chart, Renko Chart, Standard Periods, Tick Periods, Renko Periods and Range Periods.
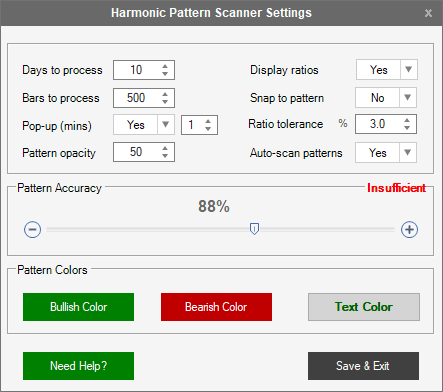
Scanner Settings
The harmonic pattern settings panel will allow you to set up your personal preferences for the indicator.
Click here for additional help

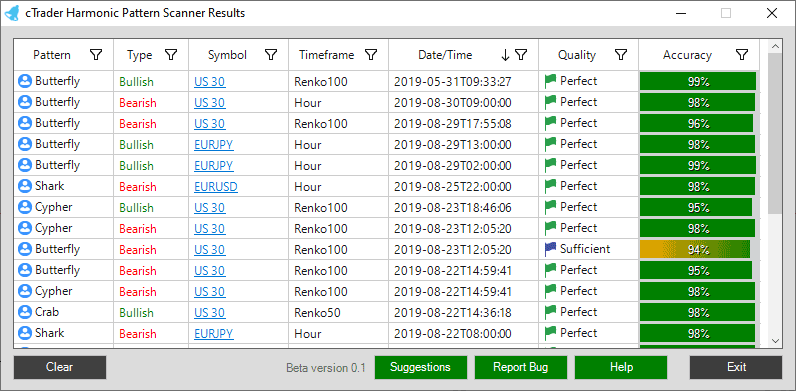
Harmonic Scanner Control Panel
This is a powerful window to have open; it holds all the symbol patterns that have been formed and will allow you to quickly navigate to the relevant chart in seconds by clicking on the symbol name. The scanner window will tell you the quality of the pattern depending on how close the predefined ratios are to the actual ratios. You can also quickly navigate to any chart and symbol to view the pattern.

How How To Automatically Submit Orders
If you are planning to use this scanner to automatically submit orders then you can use the cTrader Harmonic Pattern Trade API Client Assembly that is included with this download together with an example trading cBot and a hands-on video tutorial.
Learn How To Trade Harmonic Patterns
If you are unfamiliar with Harmonic patterns then we can help you get started and learn how to trade with them. We offer free education together with a Telegram chat group so you can talk to fellow traders about your setups and ideas.
How To Install The Indicator
First, make sure you have the cTrader trading platform installed and then simply unzip the file and double-click on it to automatically install it onto the platform.
Product User Manual
If you need help with installation and how to use this product, visit the support page.
Watch a Video Demo
We have recorded a hands-on tutorial on how to use risk management tools correctly.
Duration: 21-minutes - Watch full screen on YouTube
Need Extra Help?
Get instant answers with cTrader Sensei — our free AI assistant built for the cTrader platform. It can explain the indicator settings, suggest trading strategies, and guide you step-by-step through the use of this indicator. Rated 4.9 out of 5 in the ChatGPT Store.
Chat with cTrader Sensei
Prefer human help? Visit our support forum where our team and community can assist you.
Note: cTrader Sensei runs on OpenAI's ChatGPT platform. To use it, you will be asked to create a free OpenAI account. Registration is quick and costs nothing.
The free version works immediately, but upgrading to a ChatGPT Plus subscription unlocks the latest GPT model, which provides more accurate and detailed answers for trading, coding, and product support.
Need a Broker
If you're still looking for a broker with tight spreads and fast execution, visit our top cTrader broker site.


