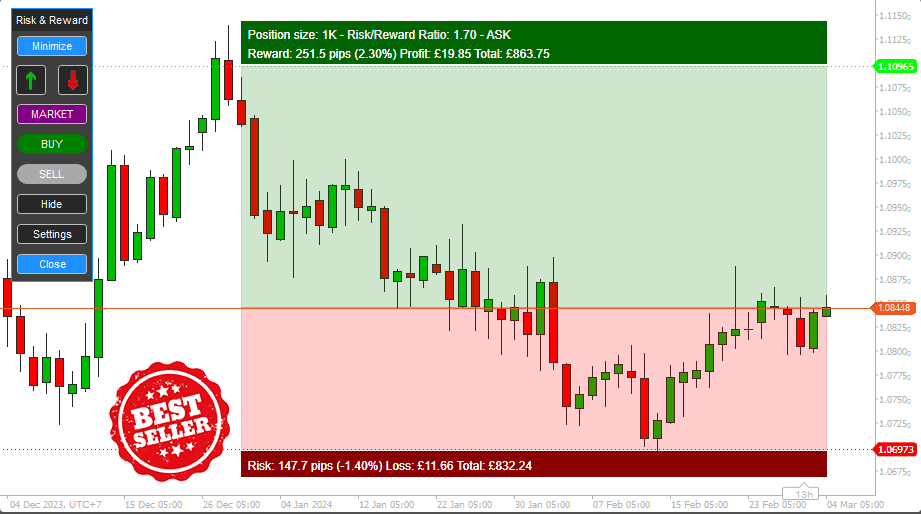
The tool allows traders to clearly define and assess the potential risks associated with a trade. By plotting risk levels on the chart, traders can see their risk exposure relative to potential rewards, helping them make more informed decisions. Risk and reward charting tools provide traders with objective criteria for evaluating trade setups. Instead of relying solely on intuition or emotions, traders can use quantitative data to assess the risk-reward ratio of each trade opportunity, leading to more disciplined and consistent decision-making.

Enhanced Trade Planning
By visualising risk and reward levels on a chart, traders can better plan their trades and set realistic profit targets and stop-loss levels. This helps traders manage their trades more effectively and avoid impulsive decisions based on market fluctuations.
The Secret of a Risk/Reward Ratio (RR)
The RR ratio is the difference between your potential profit and your potential loss of trade. You divide the number you expect to win by the number you expect to lose. If you place an order with a take profit of 100 pips and a stop loss of 50 pips, then your risk/reward will be 2, which means that you will need to win only one trade to recover the loss of 2 trades. Never take a trade if your risk/reward ratio is below 1.
Improved Risk Management
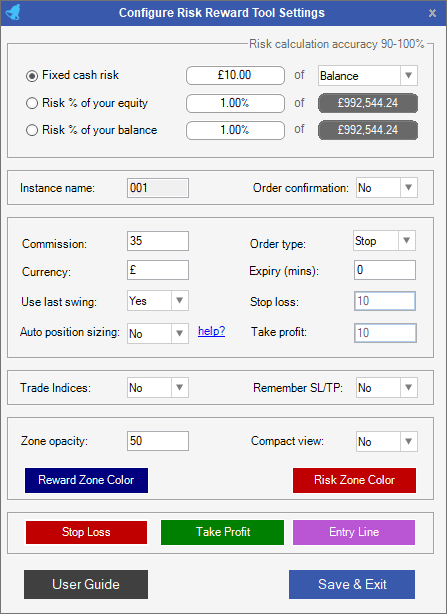
The most helpful feature of this tool is that you can set the amount you want to risk per trade as either money or as a % of your account; once this is completed in the settings panel, as shown below, the risk/reward tool will re-adjust your position size so that no matter where you position your stop loss your risk stays the same. With this invaluable tool, you can act in a fast-moving market, knowing you are not risking more than you set out to do at the start.
Charting Analysis
This tool can be used for potential trade setups, showing your risk and reward in pips, money, and as a % of your account. It gives you all the information you need to enter a trade with confidence, knowing you will not risk more of your money than you want to.
Quickly Change Order Type
From the control panel on the chart, you can quickly change the order type for fast intraday trading by simply clicking on the purple button to select Market, Stop & Limit orders.
Configurable Settings
The tool allows the trader to configure settings that suit their trading style, and as you can see below, there is a comprehensive list of configurable settings to suit everyone. This tool lets you plan your Forex and index trades.

IF YOU SEE A BLANK SCREEN, CLICK HERE FOR HELP.
Submit Market, Stop & Limit Orders
Traders can place both market and pending orders once they have used the tool to plan their trade setup, the Risk & Reward tool will then manage the predefined risk of the trade so only the pre-planned loss or profit will ever happen.
Add Advanced Risk Management
It is possible to attach profit targets, trailing stop loss, break-even & stealth stop-loss and more by using the cTrader Forex Risk Management Tool, which will do this and more. This risk manager will only work with Forex, and you will need to use the Attach to ATS feature so it manages trades only from the Risk-Reward Tool.
Visual Backtesting
You can use this tool to practice your setups with the manual strategy testing tool (Visual Mode) and adjust the speed up or down using historical data. This is a valuable method of testing your manual and automated strategies and analysing the results.
How To Install & Remove
First, make sure you have the cTrader trading platform installed, then unzip the file and double-click it to install it on the platform automatically.
Any Questions?
If you have any questions, please first search our product help forum for the answer, if you cannot find it, post a new question.
Need a Broker
If you are still looking for a broker you can trust, look at our best cTrader broker site.
Watch a Video Demo
This video shows a quick demonstration of the latest update that was published in June 2020 for version 2.0.0
Duration: 10 minutes - Watch the Video on YouTube
Product User Guide
If you need help with installation and using this product, visit the support page.
Limitations
This tool has a few limitations with cTrader, which are described below; please feel free to post a suggestion to remove these limitations.
- Only one buy and one sell trade can be submitted simultaneously per chart.
- Support for a max lot size of the broker; if you use large 6-figure accounts, please download the trial version to check.
- Volume is supported for position size, not lots; this feature is planned for the future.
- Tick charts are not supported.
- Heiken Ashi Charts with hm3 3-minute and below timeframes will not work; all other timeframes above 3 minutes are fine.
- An issue was found using Ger40.cash using FTMO.


