Indicator Overview
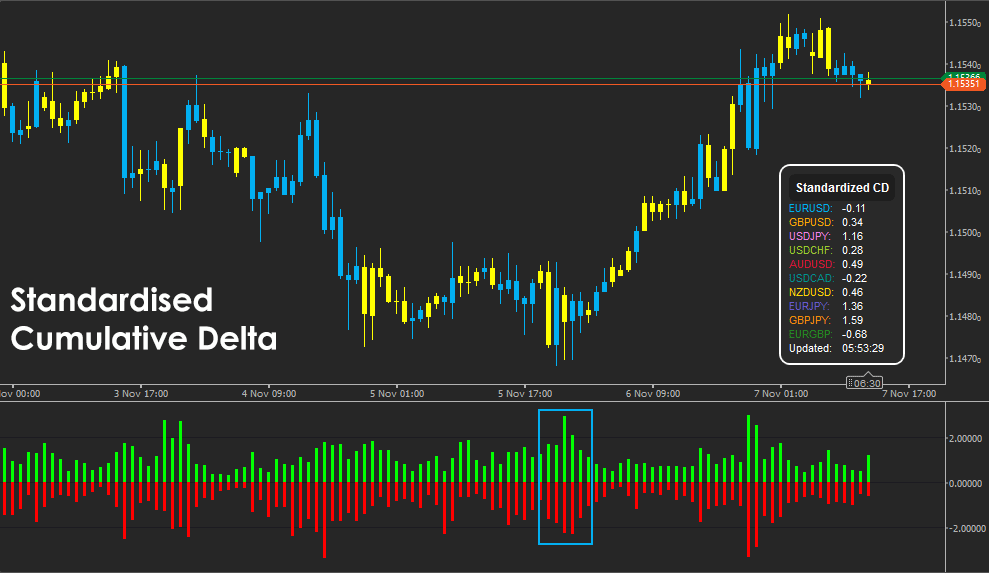
The Standardised Cumulative Delta Indicator goes beyond standard volume delta tools by focusing on price-derived deltas normalised across multiple instruments. It calculates each symbol's candle delta as Close minus Open, standardises these values over a defined lookback window, and then aggregates them to show overall bullish or bearish market bias. The result is a clear, normalised visualisation of sentiment strength across up to ten currency pairs or assets, helping traders see when markets move together or diverge.
i
The Standardised Cumulative Delta Indicator improves on the traditional cumulative delta by using z-score normalisation to compare multiple markets on the same scale. Instead of tracking raw price or volume differences, it standardises each symbol's delta relative to its volatility, allowing accurate cross-market sentiment analysis. This creates a clear visual of synchronised bullish or bearish pressure across instruments, revealing correlation and momentum shifts that standard delta or single-market tools cannot show.
Background & History
The cumulative delta concept originates from order-flow analysis, where volume differences between buyers and sellers reveal hidden market sentiment. However, in Forex and other markets without centralised volume data, price-based delta normalisation offers a practical alternative. Standardisation through z-scores allows fair comparison between symbols with different volatility characteristics, a method adapted from statistical finance and correlation modelling. This indicator combines these statistical foundations with cTrader's multi-symbol data processing to deliver a visual tool for inter-market sentiment tracking.
How the Indicator Works
The indicator calculates the delta for each candle as the difference between its closing and opening price. These deltas are collected over a configurable lookback period and standardised using z-scores (subtracting the mean and dividing by the standard deviation). This transforms raw deltas into comparable metrics across symbols of varying volatility.
Each symbol’s latest standardised delta contributes to the aggregated measures of bullish and bearish density. Depending on the chosen model — Average or Envelope — the indicator either averages positive and negative z-scores or takes the extreme values. These densities are smoothed using an exponential moving average (EMA) to remove noise. The resulting values are displayed as histograms, with green bars showing bullish strength and red bars showing bearish dominance. An optional dashboard summarises each symbol's latest delta reading, colour-coded for clarity.
Key Features
This indicator is designed for traders who monitor multiple markets simultaneously and want a normalised measure of directional bias.
-
Multi-symbol processing for up to ten instruments.
-
Automatic or manual lookback period selection.
-
Average and Envelope density modes for flexible aggregation.
-
Exponential smoothing for stability and reduced noise.
-
Optional dashboard with live symbol updates and custom corner placement.
-
Dynamic bar colouring based on dominant sentiment.
How to Use it for Trading
Traders use the Standardised Cumulative Delta Indicator to identify when multiple correlated symbols show aligned momentum — a strong sign of coordinated sentiment.
-
When the bullish density rises across symbols, it suggests broad buying pressure.
-
When bearish density dominates, it signals cross-market weakness.
These readings can confirm trend strength, warn of potential reversals, or highlight when markets decouple.
Step-by-step:
-
Add your selected symbols in the parameters section.
-
Observe when multiple pairs show consistent bullish or bearish delta values.
-
Use the histogram's colour intensity to gauge the signal's confidence.
-
Combine with moving averages or RSI to confirm directional bias.
-
For beginners, start by comparing related assets (e.g., EURUSD, GBPUSD, and AUDUSD) to observe correlation behaviour.
Complimentary Indicators
The Standardised Cumulative Delta Indicator works best when combined with momentum and confirmation tools.
-
RSI or MACD: Confirms overbought or oversold momentum shifts.
-
Volume Surprise Indicator: Identifies when abnormal volume aligns with delta spikes.
-
Moving Average or SDMA: Filters short-term trend noise.
-
Correlation Matrix Indicator: Complements the multi-symbol delta view with direct pairwise correlation analysis.
Inputs & Parameters
The indicator includes flexible options for data normalisation, visual styling, and dashboard configuration.
| Parameter |
Default/Type |
Description |
| Lookback Mode |
Auto (enum) |
Selects automatic lookback based on available bars or manual fixed bars. |
| Manual Lookback Bars |
500 (int) |
Number of bars used when Lookback Mode is Manual. |
| Density Mode |
Average (enum) |
Average uses the mean of positive and negative z-scores; Envelope uses the extremes. |
| Smoothing (EMA) |
12 (int, 1 to 100) |
Exponential smoothing applied to bullish and bearish density outputs. |
| Show Bullish Density |
True (bool) |
Displays the bullish density histogram. |
| Show Bearish Density |
True (bool) |
Displays the bearish density histogram. |
| Enable Dynamic Colors |
True (bool) |
Sets bar colour by dominant side, bullish or bearish. |
| Bullish Base Color |
LimeGreen (Color) |
Base colour for bullish dominance when dynamic colours are enabled. |
| Bearish Base Color |
Red (Color) |
Base colour for bearish dominance when dynamic colours are enabled. |
| Show Dashboard |
True (bool) |
Shows a panel with per-symbol standardised delta and last update time. |
| Dashboard Corner |
TopRight (enum) |
Positions the dashboard in a chosen corner of the chart. |
| Corner Offset X |
20 (int) |
Horizontal offset in pixels from the selected corner. |
| Corner Offset Y |
20 (int) |
Vertical offset in pixels from the selected corner. |
| Dashboard Accent Color |
White (Color) |
Accent colour for titles and borders in the dashboard. |
| Dashboard Background |
#292929 (string) |
Background colour of the dashboard container as hex string. |
| Dashboard Text Color |
White (Color) |
Text colour for dashboard content. |
| Symbol 1 |
"" (string) |
First instrument name, example EURUSD. |
| Symbol 1 Color |
Color (Color) |
Line or text colour associated with Symbol 1 in the dashboard. |
Formula Explanation
This indicator standardises each symbol's delta values and aggregates them into bullish and bearish density measures.
Δt = Closet − Opent
zt = (Δt − μ) ⁄ σ
BullishDensity = EMA( mean( zt > 0 ) )
BearishDensity = EMA( mean( zt < 0 ) )
where μ is the mean of all deltas in the lookback window and σ is their standard deviation.
Advantages
The indicator provides a unified view of market sentiment across multiple instruments in a standardized format. It adapts to volatility, making cross-symbol comparison accurate and meaningful. By aggregating normalized deltas, traders can identify coordinated moves, confirm macro-level bias, and detect when markets diverge.
Disadvantages
Because it uses price-based deltas rather than actual traded volume, it infers sentiment rather than measuring it directly. Correlation between instruments can also vary over time, reducing signal reliability during high volatility or news events. Beginners may find the concept of standardization unfamiliar, though the visual dashboard simplifies interpretation.
How To Install & Remove
First, ensure the cTrader trading platform is installed. Then unzip the file and double-click it to automatically install the platform.
Need Extra Help?
Get instant answers with cTrader Sensei — our free AI assistant built for the cTrader platform. It can explain the indicator settings, suggest trading strategies, and guide you step-by-step in using this indicator. Rated 4.9 out of 5 in the ChatGPT Store.
Chat with cTrader Sensei.
Prefer human help? Visit our support forum where our team and community can assist you.


