Indicator Overview
The Volume Surprise Indicator analyses trading volume over time and identifies when it deviates significantly from typical behaviour. By grouping volume data by hour, day, or month, and calculating average or percentile-based benchmarks, the indicator estimates what “normal” volume looks like for that period. When real-time volume exceeds expectations, it flags the event visually and, optionally, alerts the trader.
Background & History
Volume analysis has long been a cornerstone of technical trading. The idea that “volume precedes price” dates back to early Dow Theory. Modern traders have refined this concept by using statistical anomaly detection to compare current activity with expected norms. The Volume Surprise Indicator brings this analytical approach into cTrader, offering traders a quantitative way to identify when markets are behaving abnormally.
How the Indicator Works
This tool monitors each bar’s tick volume and groups it by Hour of Day, Day of Week, Day of Month, or Month. For each group, it maintains a rolling history of past volume levels. From this dataset, it calculates an expected value using either:
-
Mean: The average of previous volume readings within the group.
-
Percentile: A statistical percentile threshold (e.g., 95th percentile) representing unusually high activity.
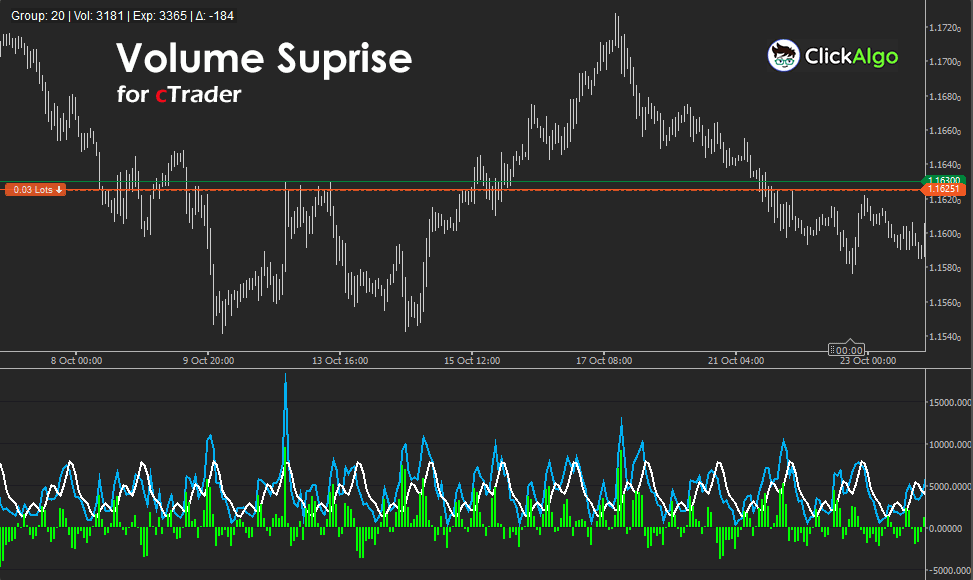
The difference between actual and expected volume is plotted as a histogram called Volume Surprise. When a spike exceeds a threshold, the indicator may display arrows or send alerts. The optional info panel provides real-time statistics for the active group.
Key Features
The Volume Surprise Indicator includes several advanced features that make it both flexible and informative. It doesn’t just show volume bars, it analyses how current activity compares to typical historical behaviour, adapting dynamically to different timeframes and trading sessions. With options for statistical grouping, smoothing, and real-time alerts, it gives traders deeper insight into when markets are behaving abnormally and whether that activity might signal institutional participation or upcoming volatility.
-
Detects statistically significant volume spikes.
-
Supports multiple grouping types for contextual analysis.
-
Mean or percentile mode for flexible statistical detection.
-
Smoothing filter for stable, noise-free expected values.
-
Optional pop-up alerts and chart arrows.
-
On-chart info panel showing group data and deviation strength.
How to Use it for Trading
Traders can use the Volume Surprise Indicator to confirm breakouts, identify accumulation zones, or detect sudden institutional activity.
-
A positive surprise (green histogram) often appears during bullish expansions or breakout candles.
-
A negative surprise (red or below baseline) may appear near exhaustion points or false breakouts.
Combining this indicator with price action or volatility tools, such as Bollinger Bands or ATR, helps filter signals and confirm true momentum. Beginners can start by using hourly or daily groupings and observing how spikes align with trend changes.
Complimentary Indicators
While the Volume Surprise Indicator excels at identifying abnormal volume behaviour, its insights become far more powerful when paired with other technical tools. Complementary indicators help confirm whether these spikes align with momentum, volatility, or price structure. By combining volume anomalies with broader market context, traders can distinguish genuine institutional activity from random bursts of noise and improve both entry timing and trade confidence.
-
Price Action or Candlestick Patterns: To interpret the context around volume spikes.
-
Average True Range (ATR): To confirm volatility expansion during volume surges.
-
VWAP or Volume Profile: To locate value areas associated with volume anomalies.
-
Momentum Indicators (MACD, RSI): To confirm whether volume spikes correspond with price momentum.
Inputs & Parameters
The indicator includes flexible inputs for data grouping, calculation method, and alert behaviour.
| Parameter |
Default/Type |
Description |
| Group By |
HourOfDay (enum) |
Selects how volume is grouped — by hour, day, or month. |
| Method |
Mean (enum) |
Defines how expected volume is calculated — average or percentile. |
| Percentile (if used) |
95 (int) |
Used when Method = Percentile, defines threshold sensitivity. |
| Length (history per group) |
50 (int) |
Number of historical samples used per group for expected calculation. |
| Smoothing Period |
3 (int) |
Applies moving average smoothing to expected values. |
| Show Info Panel |
True (bool) |
Displays live group statistics and deviations. |
| Show Arrows |
False (bool) |
Marks large volume spikes directly on the chart with icons. |
| Show Popup Alert |
True (bool) |
Triggers a visual notification when a volume spike is detected. |
Formula Explanation
The indicator calculates actual and expected volumes per group, then plots the difference as the surprise value.
Given:
t = current bar index
gt = GroupKey(OpenTimet) ∈ {HourOfDay, DayOfWeek, DayOfMonth, Month}
Vt = Bars.TickVolumes[t] (actual tick volume at t)
Hg = multiset of the last Length tick volumes observed for group g
q = Percentile / 100 (e.g., 0.95)
S = Smooth (smoothing period, integer ≥ 1)
Actual Volume:
ActualVolumet = Vt
Base Expected Volume (per group):
If Method = Mean:
Ēt(gt) = mean(Hgt)
If Method = Percentile:
Ēt(gt) = Percentile(Hgt, q)
Percentile definition (linear interpolation):
Let Hg sorted ascending be {x0 ≤ x1 ≤ … ≤ xn−1} with n = |Hg|,
p = (n − 1) · q, i = floor(p), f = p − i.
Percentile(Hg, q) =
• xn−1, if i ≥ n − 1
• xi · (1 − f) + xi+1 · f, otherwise
Smoothing of expected volume (moving average over last S base-expecteds):
For k = 0 … S − 1 (only where indices exist), compute base expected at t − k for its group gt−k: Ēt−k(gt−k).
Let K = number of available terms (1 ≤ K ≤ S). Then:
ExpectedVolumet = (1 / K) · Σk=0..K−1 Ēt−k(gt−k)
Surprise (deviation from expected):
VolumeSurpriset = Vt − ExpectedVolumet
Spike threshold and signal condition:
Thresholdt = 0.5 · ExpectedVolumet
Spiket = ( |VolumeSurpriset| ≥ Thresholdt )
Plot outputs:
ActualVolume plot: ActualVolumet
ExpectedVolume plot: ExpectedVolumet
Surprise histogram: VolumeSurpriset
Advantages
The Volume Surprise Indicator provides traders with a deeper understanding of market activity by highlighting when trading volume behaves abnormally. Instead of reacting solely to price movements, it quantifies how today’s activity compares to statistically expected levels. This helps reveal institutional footprints, accumulation zones, or breakout preparation that might otherwise go unnoticed. By dynamically adjusting to time-based patterns, such as specific hours or days, it avoids static thresholds and remains relevant in changing market conditions. The built-in smoothing and alert features make it easy to use in real time, supporting both discretionary traders and automated systems that rely on volume-based confirmation.
Disadvantages
Although powerful, this indicator’s sensitivity to sudden market events can occasionally generate false signals. Unexpected news, economic releases, or low-liquidity periods may cause volume spikes that do not necessarily correspond to meaningful price action. Traders should also be aware that statistical methods like percentiles or averages require sufficient historical data to produce reliable expectations; insufficient history may reduce accuracy. For best results, the Volume Surprise Indicator should be used alongside other tools that assess momentum, volatility, or price structure, helping filter noise and confirm genuine market shifts.
How To Install & Remove
First, ensure the cTrader trading platform is installed. Then unzip the file and double-click it to install the platform automatically.
Need Extra Help?
Get instant answers with cTrader Sensei — our free AI assistant built for the cTrader platform. It can explain the indicator settings, suggest trading strategies, and guide you step-by-step in using this indicator. Rated 4.9 out of 5 in the ChatGPT Store.
Chat with cTrader Sensei.
Prefer human help? Visit our support forum where our team and community can assist you.


