History and Background
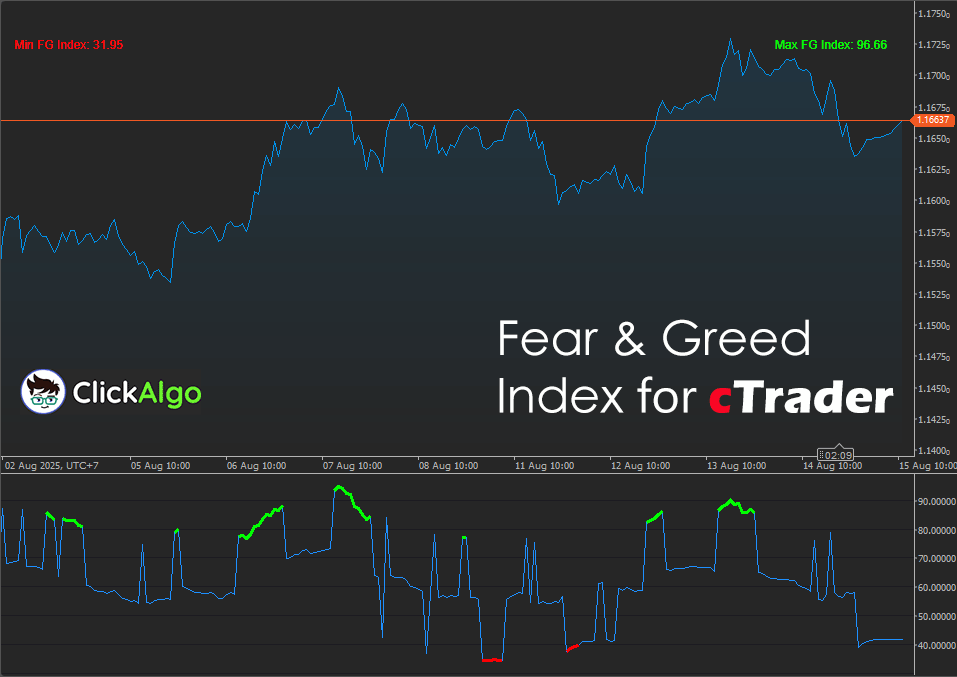
Traders have always tried to compress market mood into a simple dial. Classic recipes use one or two signals, which is tidy but narrow. This enhanced version leans into a more balanced mix, combining RSI for momentum, ATR for risk pressure, ADX for trend strength, a moving average filter for bias, and a volume surge check for participation. The result is a practical gauge that stays grounded in price action while remaining easy to interpret in real time on cTrader. The Enhanced Fear and Greed Index is a sentiment-based composite oscillator that combines multiple market metrics into a single value to reflect overall trader psychology and market conditions.
How the Indicator Works
On each bar, the indicator builds five sub-scores, normalises them to the same scale, weights them, and then combines the result into a single Fear and Greed value.
-
Momentum via RSI, normalised to a zero-to-one range
-
Volatility pressure via ATR relative to price, inverted, so lower relative volatility supports confidence
-
Trend strength via ADX, capped to avoid distortion by extreme readings
-
Directional bias via price above or below a simple moving average
-
Participation via tick volume above its moving average
It then draws:
-
A primary index line from zero to one hundred
-
Greed zone segments when the score is at or above your Greed Threshold and the price is above the SMA
-
Fear zone segments when the score is at or below your Fear Threshold and the price is below the SMA
-
On-chart annotations for Extreme Greed and Extreme Fear
-
Static max and min readouts so you can track extremes over the loaded history
Key Features
The key features of the Enhanced Fear and Greed Index are designed to give traders a complete view of market sentiment in a clear and actionable format. Each feature works together to capture momentum, volatility, trend strength, and volume confirmation, then presents this information through a single index with visual cues that are easy to interpret. By combining these elements, the indicator helps traders identify potential turning points, confirm trade setups, and stay aligned with the prevailing market mood.
-
Composite sentiment index that blends RSI, ATR, ADX, trend filter, and volume confirmation
-
Configurable weights to tune the mix for your market and timeframe
-
Greed and Fear zones are drawn only when the direction agrees with the trend filter
-
Clean zero to one hundred scale, easy to scan and automate
-
On chart text cues for Extreme Greed and Extreme Fear
-
Max and min statistics are shown on the chart for quick context
-
Works on any symbol and timeframe supported by cTrader
How to Use it for Trading (at a glance)
The Enhanced Fear and Greed Index helps identify Extreme Greed or Fear, signalling potential reversals or continuations when backed by price action. Its trend and volume checks make it useful for both short term and long term trades.
-
Bullish bias when the price is above the SMA and the index is rising toward the Greed Threshold.
-
Bearish bias when the price is below the SMA and the index is falling toward the Fear Threshold.
-
Momentum confirmation enters with the trend when a zone segment appears; manage risk with your method.
-
An exhaustion check index above ninety with a slowing price often signals an overheated condition.s
-
Mean reversion scan after an Extreme Fear annotation, look for price stabilisation back above the SMA.
-
Filter for other signals requires the index to be above fifty for long setups, below fifty for short setups.
-
Backtest thresholds keep thresholds stable across markets to avoid curve fitting.
Inputs & Parameters
All configurable parameters are listed below. The defaults are suitable starting points, but you can fine-tune the weights and thresholds to match different markets or trading styles.
| Parameter |
Default / Type |
Description |
| Inputs |
| RSI Period |
14 (int) |
Lookback for the RSI momentum component, scaled to zero to one in the index. |
| ATR Period |
14 (int) |
Lookback for the ATR volatility component, normalized by price before scoring. |
| ADX Period |
14 (int) |
Lookback for ADX trend strength, capped internally at fifty during normalization. |
| SMA Period |
50 (int) |
Simple moving average of price used for direction bias in zone gating. |
| Volume SMA Period |
20 (int) |
Simple moving average of tick volume used for participation confirmation. |
| Weights |
| Weight RSI |
1.0 (double) |
Relative importance of the RSI momentum component in the composite score. |
| Weight ATR |
1.0 (double) |
Relative importance of the ATR based volatility pressure in the composite score. |
| Weight ADX |
1.0 (double) |
Relative importance of trend strength from ADX in the composite score. |
| Weight Trend |
1.0 (double) |
Relative importance of the SMA direction filter in the composite score. |
| Weight Volume |
1.0 (double) |
Relative importance of the volume participation check in the composite score. |
| Levels |
| Greed Threshold |
75 (double) |
Index value at or above which Greed zone segments can plot when price is above the SMA. |
| Fear Threshold |
40 (double) |
Index value at or below which Fear zone segments can plot when price is below the SMA. |
Formulas
The Elder Impulse Enhanced calculates the slope of a short-term EMA and the slope of the MACD Histogram over a lookback window, then classifies each bar as bullish, bearish, or neutral using a small tolerance epsilon.
Slope Calculation
For any series S and lookback length n:
Let:
p_t = close price at time t
RSI_t = RSI(RsiPeriod) at time t, in [0,100]
ATR_t = ATR(AtrPeriod) at time t
ADX_t = ADX(AdxPeriod) at time t
SMAp_t = SMA of price over SmaPeriod at time t
SMAv_t = SMA of tick volume over VolumeSmaPeriod at time t
Vol_t = tick volume at time t
Weights: w_rsi, w_atr, w_adx, w_trend, w_vol
Total weight: W = w_rsi + w_atr + w_adx + w_trend + w_vol
Advantages
The main advantage of the Enhanced Fear and Greed Index is that it condenses multiple market dimensions such as momentum, volatility, trend direction and volume participation into a single easy to read score, allowing traders to quickly gauge overall market sentiment without manually analyzing separate indicators. By using weighted inputs and trend aware filtering it reduces false signals, adapts to different market conditions and provides clear visual cues for Extreme Greed and Extreme Fear, making it a practical tool for both discretionary and systematic trading.
Disadvantages
Composite indices can hide which component is doing the heavy lifting, so always sanity check with the raw chart. The SMA and volume filters make zone signals more selective, which can mean fewer trades in choppy sessions. Finally, threshold tuning that is too aggressive risks curve fitting, prefer simple round levels that transfer across symbols.
How To Install & Remove
First, ensure that you have the cTrader trading platform installed. Then, unzip the file and double-click it to install the platform automatically.
Need Extra Help?
Get instant answers with cTrader Sensei — our free AI assistant built for the cTrader platform. It can explain the indicator settings, suggest trading strategies, and guide you step-by-step through this indicator. Rated 4.9 out of 5 in the ChatGPT Store.
Chat with cTrader Sensei
Prefer human help? Visit our support forum where our team and community can assist you.
Note: cTrader Sensei runs on OpenAI's ChatGPT platform. To use it, you will be asked to create a free OpenAI account. Registration is quick and costs nothing.
The free version works immediately, but upgrading to a ChatGPT Plus subscription unlocks the latest GPT model, which provides more accurate and detailed answers for trading, coding, and product support.
To upgrade, log in to ChatGPT, click your profile in the bottom left, and select Upgrade to Plus.
Need a Broker
If you're still looking for a broker with tight spreads and fast execution, visit our top cTrader broker site.


