Indicator Overview
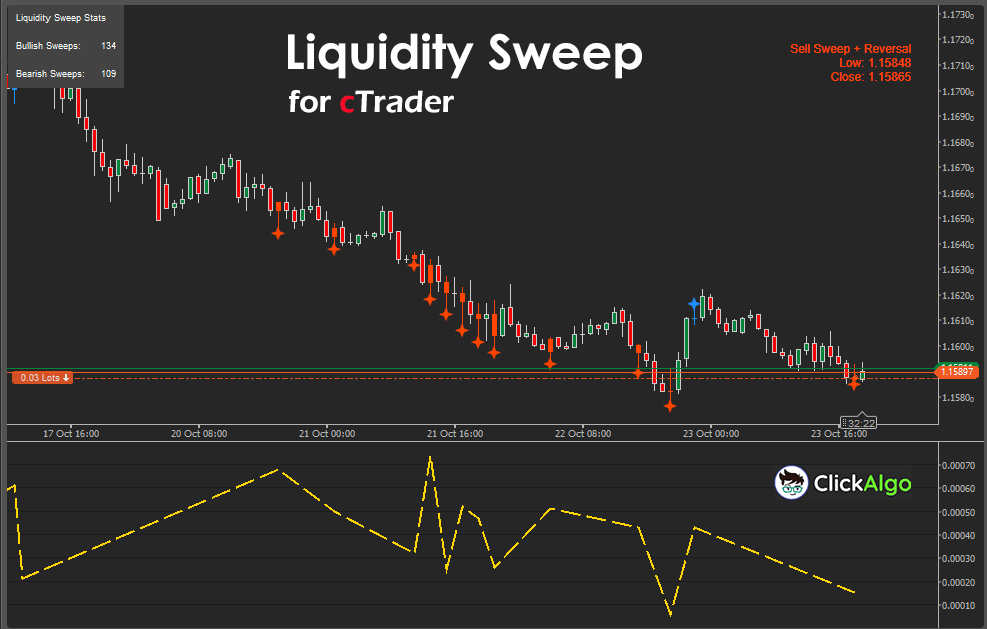
The Liquidity Sweep Indicator automatically identifies bars where the price has swept through recent highs or lows and then reversed. These sweeps often mark stop-hunts or liquidity grabs, moments when large players trigger retail stops before pushing the market in the opposite direction. The indicator visually marks these events using customizable icons, bar colours, text banners, and optional pop-up alerts, while maintaining running statistics on the number of bullish and bearish sweeps detected.
Background & History
Liquidity sweeps are a key concept in modern smart money trading. They occur when the price briefly pierces a well-known level of liquidity, such as a recent high or low, and then snaps back, leaving trapped traders in its wake. This concept has roots in institutional order flow theory, where major players accumulate or distribute positions during these fake breakouts. The Liquidity Sweep Indicator was designed to automate the visual detection of these events, reducing the guesswork and improving timing for both discretionary and algorithmic traders.
How the Indicator Works
The indicator continuously analyses bar highs and lows over a specified lookback period.
-
It compares the current bar’s high to the highest high of the last n bars, and its low to the lowest low of the same period.
-
If price breaks above the recent high but closes back below it, a bullish sweep is detected.
-
If price dips below the recent low but closes back above it, a bearish sweep is detected.
-
Each detected sweep can trigger visual elements: icons above or below the bar, bar recolouring, a floating text banner, and a count of total sweeps.
-
The indicator also outputs a data series (“Sweep Strength”) that measures the reversal magnitude from the sweep point.
This makes it easy to spot when markets have just grabbed liquidity and are likely to reverse direction.
Key Features
The Liquidity Sweep Indicator provides traders with intuitive, real-time feedback about liquidity events.
-
Detects both buy- and sell-side liquidity sweeps automatically.
-
Configurable lookback period and visual settings.
-
Optional alerts for live monitoring.
-
Sweep strength output line for backtesting or strategy integration.
-
Built-in statistics panel tracking total bullish and bearish sweeps.
How to Use it for Trading
The Liquidity Sweep Indicator helps traders identify moments when price has manipulated liquidity around recent highs or lows, often just before a reversal or retracement begins. The goal is to trade in the opposite direction of the sweep once confirmation appears.
Here’s how traders can use it effectively:
-
Identify the Sweep Event.
When the indicator marks a bullish sweep, it means the price has taken out recent highs and then closed back below them. This suggests trapped buyers and potential downward reversal.
A bearish sweep indicates price has taken out recent lows and then closed above them, hinting at trapped sellers and a likely upward reversal.
-
Wait for Confirmation.
Don't enter immediately on a sweep. Wait for a confirming candle, such as a strong engulfing bar, pin bar, or a break of structure on a lower timeframe. This filters out false signals during trending markets.
-
Trade Entry.
Enter a position in the opposite direction of the sweep once confirmation occurs:
-
After a bullish sweep, consider shorting when the next bar closes below the swept high.
-
After a bearish sweep, consider going long when the next bar closes above the swept low.
-
Stop Loss Placement.
Place your stop-loss just beyond the sweep point, slightly above the swept high for shorts or below the swept low for longs. This keeps risk minimal while aligning stops with logical liquidity zones.
-
Take Profit Strategy.
Profit targets can be based on nearby structural points, such as the next swing high/low, fair-value gaps, or mid-range liquidity zones. Many traders also use a 1:2 or 1:3 risk-to-reward ratio as a baseline.
-
Higher Timeframe Context.
Liquidity sweeps are most effective when aligned with a higher timeframe structure. For example, a bullish sweep on the 15-minute chart that occurs within a daily demand zone carries stronger reversal potential than one in open space.
-
Confluence with Other Tools.
Combine this indicator with complementary tools such as volume, order blocks, or fair-value gaps to confirm institutional intent. For example, a sweep followed by an order block retest is a common smart money entry pattern.
-
For Beginners.
Start by observing historical sweeps on the chart. Note how the price behaves afterwards, whether it reverses or continues. This visual study helps develop intuition before trading live. When ready, begin with demo trades using clear stop and target rules.
By focusing on where liquidity is taken and how the price reacts afterwards, traders can use the Liquidity Sweep Indicator to anticipate smart money reversals rather than reacting to them. It is a strategic tool for both scalpers seeking quick reversals and swing traders waiting for clear structural shifts.
Complimentary Indicators
The Adaptive Price Volume Indicator can be combined with several other tools to refine trade entries and reduce false signals. These combinations help confirm direction, validate momentum strength, and identify optimal timing.
-
cTrader Volume Heatmap Overlay. Shows where trading activity concentrates across price levels, allowing traders to confirm that a signal occurs near strong volume zones.
-
cTrader Trend Strength Meter. Provides a higher-timeframe directional filter so traders only take adaptive signals in the dominant trend direction.
- cTrader Fair Value Gap Indicator: Highlights price inefficiencies often filled following a sweep.
Using these complementary tools together allows traders to combine dynamic signal generation with trend confirmation, volume validation, and automated protection for a more structured trading approach.
Inputs & Parameters
The indicator includes configurable settings that let traders customise how sweeps are detected and displayed.
| Parameter |
Default/Type |
Description |
| Lookback Bars |
20 / Integer |
Number of past bars used to determine recent highs and lows. |
| Mark Sweeps |
true / Boolean |
Draws an icon above or below bars where sweeps are detected. |
| Colour Bars On Sweep |
true / Boolean |
Applies colour highlighting to bars where sweeps occur. |
| Buy Sweep Colour |
DodgerBlue / String |
Colour used to highlight bullish sweep bars. |
| Sell Sweep Colour |
OrangeRed / String |
Colour used to highlight bearish sweep bars. |
| Sweep Icon Type |
Star / ChartIconType |
An icon shape is drawn on the bar when a sweep is detected. |
| Show Sweep Text |
true / Boolean |
Displays static text with sweep details on the chart. |
| Show Alerts |
false / Boolean |
Shows pop-up alerts when new sweeps occur. |
Formula Explanation
The Liquidity Sweep Indicator works by detecting when the price exceeds recent highs or lows within a lookback window, then reversing. This is interpreted as a liquidity sweep, a signal that liquidity has been taken and the price may change direction.
Bullish Sweep:
If the current bar's high is higher than the highest high of the last n bars, and the close is below that previous high, it is marked as a bullish sweep.
Bearish Sweep:
If the current bar’s low is lower than the lowest low of the last n bars, and the close is above that previous low, it is marked as a bearish sweep.
Sweep Strength:
The sweep strength is calculated as the absolute difference between the extreme price (the high or low) and the closing price of the same bar.
Bullish Sweep → (Highₜ > max(Highₜ₋ₙ … Highₜ₋₁)) and (Closeₜ < max(Highₜ₋ₙ … Highₜ₋₁))
Bearish Sweep → (Lowₜ < min(Lowₜ₋ₙ … Lowₜ₋₁)) and (Closeₜ > min(Lowₜ₋ₙ … Lowₜ₋₁))
Sweep Strength → |Extreme Price − Closeₜ|
Advantages
The Liquidity Sweep Indicator gives traders a deeper understanding of how markets move around liquidity. It visually isolates high-probability reversal points, helping identify exhaustion zones and avoid false breakouts. It can be used for both discretionary trading and as an analytical overlay in automated systems.
Disadvantages
As with all pattern-based indicators, false signals can occur during strong trending conditions when breakouts continue without reversal. It is not a standalone trading system and should be combined with confluence tools such as volume or structure-based indicators for best results.
How To Install & Remove
First, ensure the cTrader trading platform is installed. Then unzip the file and double-click it to install the platform automatically.
Need Extra Help?
Get instant answers with cTrader Sensei — our free AI assistant built for the cTrader platform. It can explain the indicator settings, suggest trading strategies, and guide you step-by-step in using this indicator. Rated 4.9 out of 5 in the ChatGPT Store.
Chat with cTrader Sensei.
Prefer human help? Visit our support forum where our team and community can assist you.
Note: cTrader Sensei runs on OpenAI's ChatGPT platform. To use it, you will be asked to create a free OpenAI account. Registration is quick and costs nothing.
The free version works immediately, but upgrading to a ChatGPT Plus subscription unlocks access to the latest GPT model, which provides more accurate, detailed answers for trading, coding, and product support.
Need a Broker
If you're still looking for a broker with tight spreads and fast execution, visit our top cTrader broker site.


