History and Background
The Neural Network Oscillator (NNO) is a momentum and trend detection tool built around a compact feed-forward neural network. It’s trained using a genetic algorithm, allowing it to evolve and fine-tune its weight parameters based on historical market behaviour.
Unlike other indicators that use fixed calculation formulas, this indicator adapts to past price patterns, making it more responsive to changing market conditions, helping traders identify bullish and bearish signals with greater accuracy. This implementation combines price returns, momentum, RSI deviation, and moving average spreads as inputs to a four-neuron hidden layer network, whose weights are optimised for maximal predictive alignment with future price movements.
Input Parameters
| Parameter |
Type |
Description |
Default Value |
| Momentum Period |
Integer |
Number of bars to use for momentum calculation |
14 |
| RSI Period |
Integer |
Look-back period for the Relative Strength Index |
14 |
| Fast SMA |
Integer |
Period for the fast Simple Moving Average |
5 |
| Slow SMA |
Integer |
Period for the slow Simple Moving Average |
20 |
Algorithmic Workflow
On initialisation, the indicator computes the Relative Strength Index (RSI) and both fast and slow Simple Moving Averages (SMAs) on the closing‐price series. Once those inputs are ready, it instantiates the integrated genetic optimiser, which evolves a population of candidate weight sets and ultimately selects the best vector of 25 neural‐network weights for use in subsequent calculations.
Genetic Optimization
-
Population: 100 random individuals, each with 25 weights initialised uniformly in [-1, 1].
-
Fitness Evaluation: For each candidate, simulate the network across historical bars (from index 50 onward). Compute the network's output final via:
hidden[h] = tanh(sum(inputs * weights_hidden + bias_hidden));
final = tanh(sum(hidden * weights_output + bias_output));
Score = average of final * priceDelta, where priceDelta = nextClose - currentClose.
-
Evolutionary Loop: Over 100 generations, perform tournament selection (k=5), one-point crossover (70% rate), and Gaussian-like mutation (10% rate, amplitude 0.5).
-
Result: The weight set yielding the highest fitness becomes the operational parameter for the live indicator.
Real-Time Calculation
-
At each new bar, compute four inputs:
-
Return: 100 × (Close today − Close yesterday) / Close yesterday
-
Momentum: Close today − Close[n bars ago]
-
RSI Deviation: (RSI − 50) / 50
-
SMA Spread: (FastSMA − SlowSMA) × 10,000
-
Forward-propagate through the neural net with the pre-trained weights.
-
Apply tanh activation of the hidden layer and output.
-
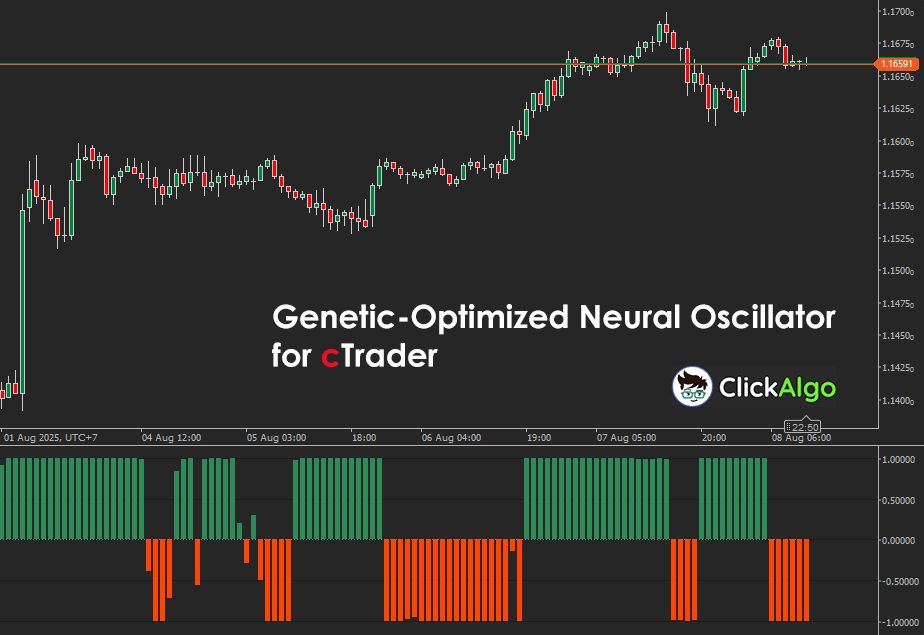
Output histograms:
-
BullishResult = max(0, final)
-
BearishResult = max(0, −final)
-
ZeroLine = 0 baseline
Key Features
-
Adaptive Training: Uses a genetic optimiser to evolve network weights over multiple generations, maximising a fitness function tied to next-period price changes.
-
Multi-Input Design: Incorporates rate-of-return, price momentum, RSI deviation from neutral, and fast-versus-slow SMA differential, capturing both trend and overbought/oversold conditions.
-
Compact Architecture: Four inputs, one hidden layer of four neurons, and a single output, balancing computational efficiency and expressive capacity.
-
Clear Visuals: Outputs separate bullish and bearish histograms alongside a zero baseline for immediate interpretation of directional strength.
How to Use it for Trading
-
Bullish Histogram: Height corresponds to predicted positive momentum. Peaks suggest strong upcoming upswings.
-
Bearish Histogram: Depth indicates predicted negative momentum. Valleys warn of potential downturns.
-
Zero Line: Crossing events mark shifts in directional bias; treat as confirmation of other signals.
Genetic optimization may require several seconds to minutes to complete, depending on the length of the historical data, so it’s best to schedule training during off-peak hours; once the optimal weights are determined, the oscillator’s compact neural network runs efficiently in real time, even on lower-end systems.
How To Install & Remove
First, ensure that you have the cTrader trading platform installed. Then, unzip the file and double-click it to install the platform automatically.
Need Extra Help?
Get instant answers with cTrader Sensei — our free AI assistant built for the cTrader platform. It can explain the indicator settings, suggest trading strategies, and guide you step-by-step through this indicator. Rated 4.9 out of 5 in the ChatGPT Store.
Chat with cTrader Sensei
Prefer human help? Visit our support forum where our team and community can assist you.
Note: cTrader Sensei runs on OpenAI's ChatGPT platform. To use it, you will be asked to create a free OpenAI account. Registration is quick and costs nothing.
The free version works immediately, but upgrading to a ChatGPT Plus subscription unlocks the latest GPT model, which provides more accurate and detailed answers for trading, coding, and product support.
To upgrade, log in to ChatGPT, click your profile in the bottom left, and select Upgrade to Plus.
Need a Broker
If you're still looking for a broker with tight spreads and fast execution, visit our top cTrader broker site.


