Indicator Overview
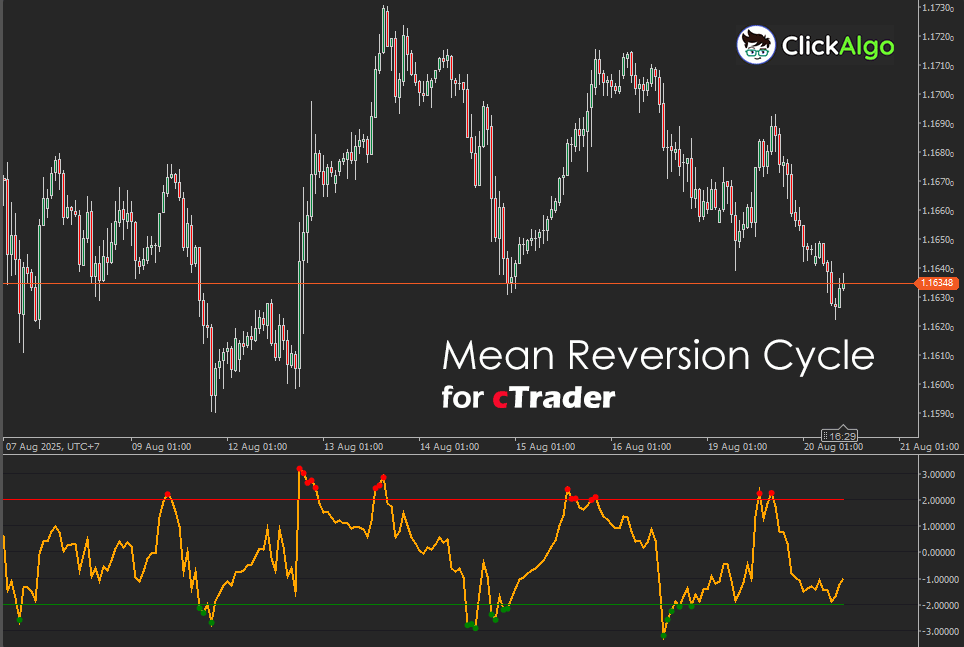
The Mean Reversion Cycle Model standardises the current close against a rolling average and its matching standard deviation to produce a Z score that oscillates around zero. Positive readings show strength relative to the recent mean; negative readings show weakness. Horizontal guidelines mark your chosen extreme level, and optional buy or sell markers appear when the Z score moves beyond those bounds.
Background & History
Mean reversion has guided traders since the pit era, where prices often migrated back toward a perceived fair value. The Z score emerged from early statistical work as a way to normalise distance by volatility, which makes the stretch comparable across assets and timeframes. This indicator brings that simple, durable idea to cTrader with a clean display and explicit thresholds.
How the Indicator Works
Each bar computes a simple moving average and a standard deviation over a user-selected lookback. The close is then expressed as several standard deviations from that mean.
-
Readings above the upper line indicate statistically stretched strength.
-
Readings below the lower line indicate statistically stretched weakness.
-
Buy and sell dots plot only when the Z score exceeds your threshold.
Key Features
A clear Z-score oscillator centred on zero with user-defined thresholds and optional extreme markers. It is transparent, parameter light, and suitable for any liquid symbol or timeframe.
-
Standardised scale for quick cross-market comparison.
-
Configurable rarity of signals via the threshold input.
-
Works as a stand-alone stretch gauge or as a filter within systems.
How to Use it for Trading (at a glance)
Use the Z score as a stretch meter. In range-bound conditions, consider fading moves that close beyond the negative line for buys and beyond the positive line for sells, then scale out near the mean and at a set profit multiple. In trending markets, add a bias filter such as a higher timeframe moving average and take only pullbacks that align with the dominant direction. Always set risk at structure, avoid stacking multiple entries into news spikes, and reduce size when volatility expands.
Inputs & Parameters
Choose a lookback that matches your trading rhythm. Shorter periods react quickly but add noise; longer periods are smoother but slower. The threshold controls how rare a signal must be before a dot appears.
| Parameter |
Default / Type |
Description |
| Inputs |
| Period |
20 (int) |
Lookback for the simple moving average and standard deviation used to compute the Z score. |
| Z score Threshold |
2.0 (double) |
Absolute level that defines extremes. Buy dots plot when Z is below the negative level, sell dots plot when Z is above the positive level. |
Formulas
Given close series Ct and lookback N:
Simple moving average
SMAt = (1 ÷ N) × Σi=0..N−1 Ct−i
Standard deviation
σt = √{ (1 ÷ N) × Σi=0..N−1 [ Ct−i − SMAt ]2 }
Z score
Zt = ( Ct − SMAt ) ÷ σt if σt ≠ 0, otherwise NaN
Thresholds
Upper = +T, Lower = −T, where T is the user threshold
Signals
Buy dot at t if Zt < −T Sell dot at t if Zt > +T
Advantages
Standardization makes the output comparable across assets and timeframes. The indicator adapts to volatility by measuring true statistical stretch rather than raw distance. The display is uncluttered, thresholds are explicit, and the logic is easy to test, automate, and explain to customers.
Disadvantages
Strong trends and shock events can cause repeated extreme readings while price keeps moving away from the mean. Without a trend filter and strict risk rules, counter moves can stack losses before reversion arrives.
How To Install & Remove
First, ensure that you have the cTrader trading platform installed. Then, unzip the file and double-click it to install the platform automatically.
Need Extra Help?
Get instant answers with cTrader Sensei — our free AI assistant built for the cTrader platform. It can explain the indicator settings, suggest trading strategies, and guide you step-by-step through this indicator. Rated 4.9 out of 5 in the ChatGPT Store.
Chat with cTrader Sensei
Prefer human help? Visit our support forum where our team and community can assist you.
Note: cTrader Sensei runs on OpenAI's ChatGPT platform. To use it, you will be asked to create a free OpenAI account. Registration is quick and costs nothing.
The free version works immediately, but upgrading to a ChatGPT Plus subscription unlocks the latest GPT model, which provides more accurate and detailed answers for trading, coding, and product support.
To upgrade, log in to ChatGPT, click your profile in the bottom left, and select Upgrade to Plus.
Need a Broker
If you're still looking for a broker with tight spreads and fast execution, visit our top cTrader broker site.


