The cTrader Trendline trading system is very useful to help traders know when a price breakout or pullback has occurred, it not only shows a popup window but will also send an email or instant telegram message directly to your mobile phone as well as automatically submit a market order with a buy or sell direction depending on your settings.
What is a Trendline?
Trend lines are probably the most common form of technical analysis used by traders, a trend line is a line that is drawn over the pivot highs or under the pivot lows which helps to show the price direction, these lines show visually the support and resistance levels in any timeframe on the charts.
Available Actions
The following actions are available with this trading robot.
- Buy On Breakout (BoB)
- Sell On Breakout (SoB)
- Buy On Pullback (BoP)
- Sell On Pullback (SoP)
- Close trade on opposite action.
- Check for signals or activate pending orders on candle close or on each price change (tick).
What is a breakout?
A breakout is when the price moves above or below a support or resistance level, this can apply to horizontal lines or trend lines and this will show the key levels for the average high and low points. When this happens there is a high chance that many buyers, sellers and automated trading systems will see the breakout and join the new trend direction. The volume should also be analysed when a breakout occurs, a high volume shows conviction that the trade will continue in the breakout direction.
What is a pullback?
A pullback or retracement is when in a trending market there is a retrace of a portion of the gains before continuing in the same direction. A pullback usually shows the trader that the overall market trend has temporarily paused.
How does it work?
You simply follow the steps below.
- Open the symbol chart you wish to use.
- Add the cBot to a chart.
- Adjust the cBot settings for the alert message and pending order setup.
- Start the cBot.
- Identify possible upper and lower trendlines from the high and low points.
- Draw the trendlines connecting the high or low points.
- Go about your day and when the price reaches a trendline a trade will automatically open and be managed.
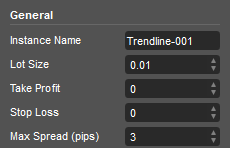
General Settings
When you first start this cBot you will need to configure it for the symbol you wish to trade, the following settings are under the general grouping.
Instance name
You only need to use this when you have attached the cBot to another chart with the same symbol and timeframe and need them to work independently, make sure your use a unique instance name, you do not need to use this setting if you are using different symbols.
The other settings are self-explanatory as these are the lot size (position size), take profit and stop loss in pips.
Max spread (pips)
The max spread feature will prevent positions from being opened when the spread widens, this will help prevent losses due to small stop losses, an example would be that the spread widens to 10 pips, if your trade opened then it would be 10 pips at a loss from the start, if you stop loss is 5 pips, your trade will close at a loss as soon as it opens.
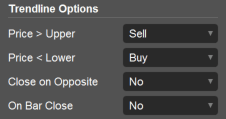
Trendline Options
The options for setting the trendline trading rules are covered here.
Price > Upper
This sets the trigger to open a buy or sell position when the symbol price breaks past the upper trendline, a breakout would usually involve a buy position being placed and a pullback would involve a sell position.
Price < Lower
This sets the trigger to open a buy or sell position when the symbol price breaks past the lower trendline, a breakout would usually involve a sell position being placed and a pullback would involve a buy position.
Close on Opposite
This setting gives you the option to close an opposite trade when the price breaks above or below a trendline, an example would be that a buy position opens when the price breaks above the upper trendline, but if it reverses and breaks below the lower trendline the buy position will automatically close.
On Bar Close
This allows the checks for the price breaking the trendlines to be done when the candle closes or as soon as it happens, a candle is also known as a bar.
Features
This cBot will not only automatically submit pending orders based on the trendlines, but it will also display a popup and send an email & instant telegram message to your phone.
Backtesting
You will not be able to backtest this robot as it requires user interaction to draw the trendlines.
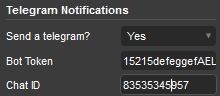
How to Configure Alerts
- To receive a pop-up alert, you just need to turn this on from the indicator settings.
- To receive an email alert you will need to configure your email account with cTrader first and then enter the email address in the indicator settings window where you wish the alert to be sent.
- To receive Telegram alerts you will need to create a Telegram account and get your ChatID and Bot Token.
Limitations
- One of the current limitations of this indicator is that you can only add a maximum of 2 trend lines to the chart.
- When the trendline is breached, it is removed from the chart as the trendline is no longer valid and you will need to draw a new one.
Watch a Video Demonstration
This video was recorded in 1080p HD, please update your YouTube settings.
Duration: 7-minutes - Watch the Video on YouTube

How To Install & Remove
First, make sure you have the cTrader trading platform installed and then simply unzip the file and double-click on it to automatically install it onto the platform.
Need Extra Help?
Get instant answers with cTrader Sensei — our free AI assistant built for the cTrader platform. It can explain the indicator settings, suggest trading strategies, and guide you step-by-step through the use of this indicator. Rated 4.9 out of 5 in the ChatGPT Store.
Chat with cTrader Sensei
Prefer human help? Visit our support forum where our team and community can assist you.
Note: cTrader Sensei runs on OpenAI's ChatGPT platform. To use it, you will be asked to create a free OpenAI account. Registration is quick and costs nothing.
The free version works immediately, but upgrading to a ChatGPT Plus subscription unlocks the latest GPT model, which provides more accurate and detailed answers for trading, coding, and product support.
To upgrade, log in to ChatGPT, click your profile in the bottom left corner, and select 'Upgrade to Plus'.
Need a Broker
If you're still looking for a broker with tight spreads and fast execution, visit our top cTrader broker site.


