All-day traders who use indicators for manual trading will benefit from using this indicator as it can be used on different timeframes and is perfect with currency pairs (Forex) to help identify trend continuation or breakouts. This indicator will inform the trader when there is a break-out with a popup window and an audible alert.
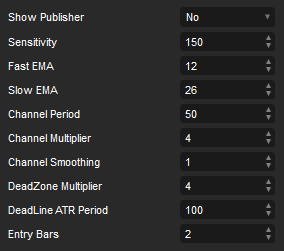
It measures the price volatility or explosion with the help of a difference between upper and lower Bollinger bands, also known as the squeeze that uses a slow MACD advance or decline weighted with a coefficient sensitivity of 150 as shown in the settings.
Advantages
A major advantage of using the Waddah Attar Explosion indicator is that it can help traders identify the periods in the price when a strong move is starting to happen, these moves can be bullish or bearish and even against the current trend direction. Traders can take advantage of these signals by entering a trade in the direction of the price breakout as soon as the popup window informs them.
How to Use This Indicator
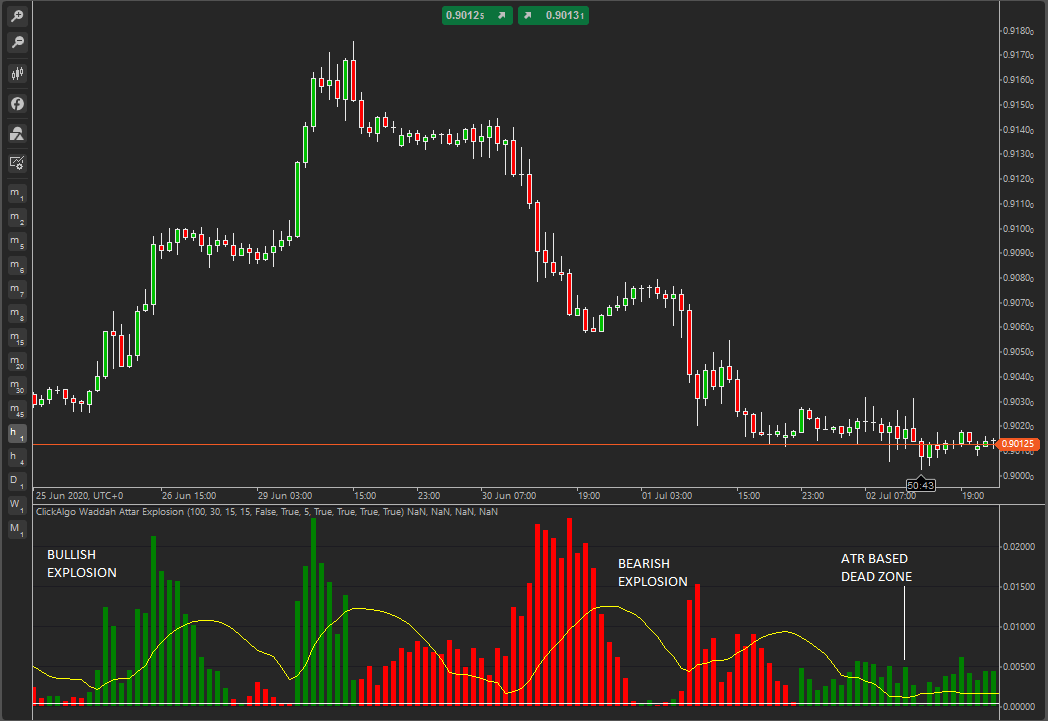
The Waddah Attar indicator is straightforward to use by all traders with different experience levels and the image below shows examples of both a bullish, bearish explosive trend and also when there is a dead zone of no trend direction. This indicator is also very useful for identifying periods when the price is neither bullish nor bearish, but instead simply ranging with no real direction.
A trader who Trades a range requires a particular set of skills that most traders do not have, so it is advised that they should avoid trading ranges as much as possible during the trading day.
Bullish Buy Signal
- Progressively longer green bars.
- The explosive yellow line is rising above the white (dead zone).
- [Entry bar number] Previous green bars are above the explosive line.
Exit Buy Signal
- Exit when a Green bullish bar drops below the explosion line.
- You can also exit your trade when there is a Bearish signal.
Bearish Sell Signal
- Progressively longer red bars.
- The explosive yellow line is rising above the white (dead zone).
- [Entry bar number] The previous red bars are above the explosive line.
Exit Sell Signal
- Exit when a Red bearish bar drops below the explosion line.
- You can also exit your trade when there is a Bullish signal.
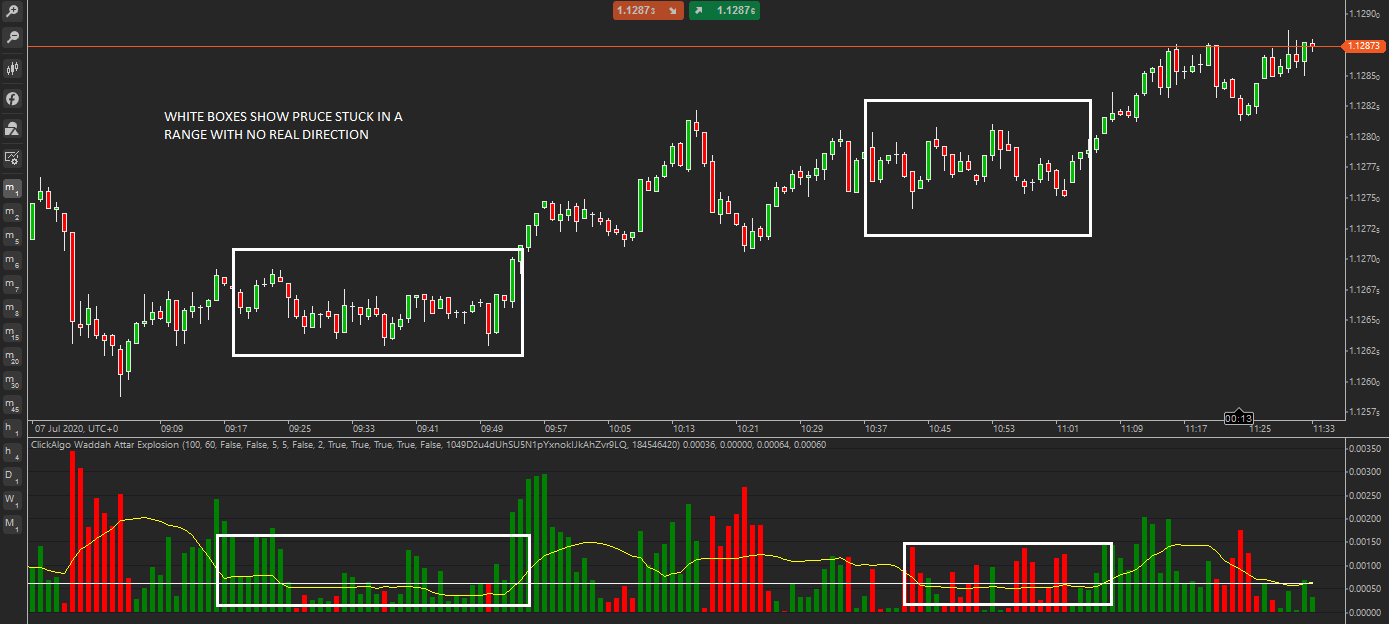
Stuck in a Range
- Short red and green bars.
- No movement up or down the explosive yellow line.
Settings Explained
We have tried our best to research the internet to get the true meaning of the indicator settings shown below, if you feel that they are incorrect or could be improved, please drop us an email. Timeframe: The author suggests using this indicator for 30 minutes.
Strength Settings
These settings will give weight to any signal generated, you can turn this off to get signals for the standard conditions for this indicator or you can turn it on to only trade when both the explosion line and the trend bars show a strong movement, you will need to experiment with different values for different instruments.
Entry Bars
This is the number of bars above the explosion line that fires a signal.
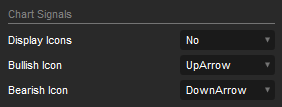
It is also possible to display on the chart icon images when there is a signal to buy or sell.
Telegram & Email Alerts
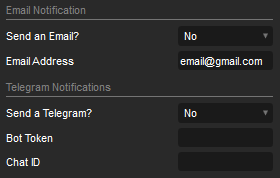
You can also configure the system to send both email and Telegram alerts to your desktop PC or mobile phone.
Dead-Zone Level Explained
This is a very important level as it helps to filter out signals when the price is stuck in a RANGE with no real direction, it is important to set the dead zone pips so that the line is above the yellow explosion line where you see historical ranges in the price as shown below, by doing this you will prevent false signals to enter or exit a trade.
Dead Zone & Timeframes
The dead-zone level is very important as it is the threshold for signals, as it uses the number of pips above the baseline (zero) when you use a low timeframe like 1-min the dead-zone line will be very high up where a 1-hour or more timeframe shows it near the baseline of zero.
Instant Telegram Alerts
A useful feature included with this indicator is the ability to receive instant Telegram alerts when a signal is generated, if you are new to Telegram then you can use our Free Telegram testing and configuration tool to help you get started, you can find it below.
PLEASE NOTE TELEGRAM ALERTS ARE ONLY SENT FOR BUY OR SELL SIGNALS.
Chart Signals
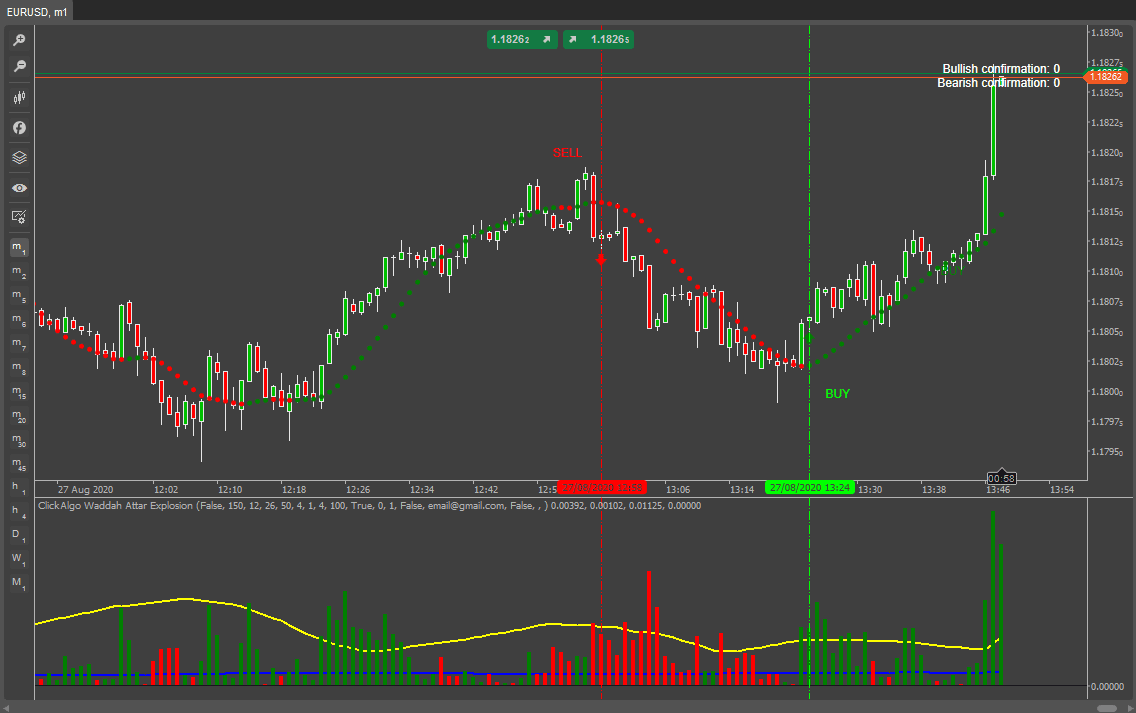
When there is a signal to enter a trade an arrow icon is displayed on the chart by the closed candle, there will be an arrow for each signal, so you may see multiple bullish or bearish arrows when there are bars above the explosion line.
Manual Trade Setup Using a Trend Surfing Indicator
The trade setup shown below uses the ClickAlgo Trend Surfing Indicator for extra confirmation before entering a trade.
Watch a Video Explainer
We have recorded a hands-on tutorial on how to use the indicator.
Duration: 10 minutes - Watch full screen on YouTube
How To Install & Remove
Follow the instructions below to install this indicator.
Any Questions?
If you have any questions, search our product help forum for the answer, or post a new question.
Need a Broker
If you are still looking for a Trustful broker, look at our best cTrader broker site.


