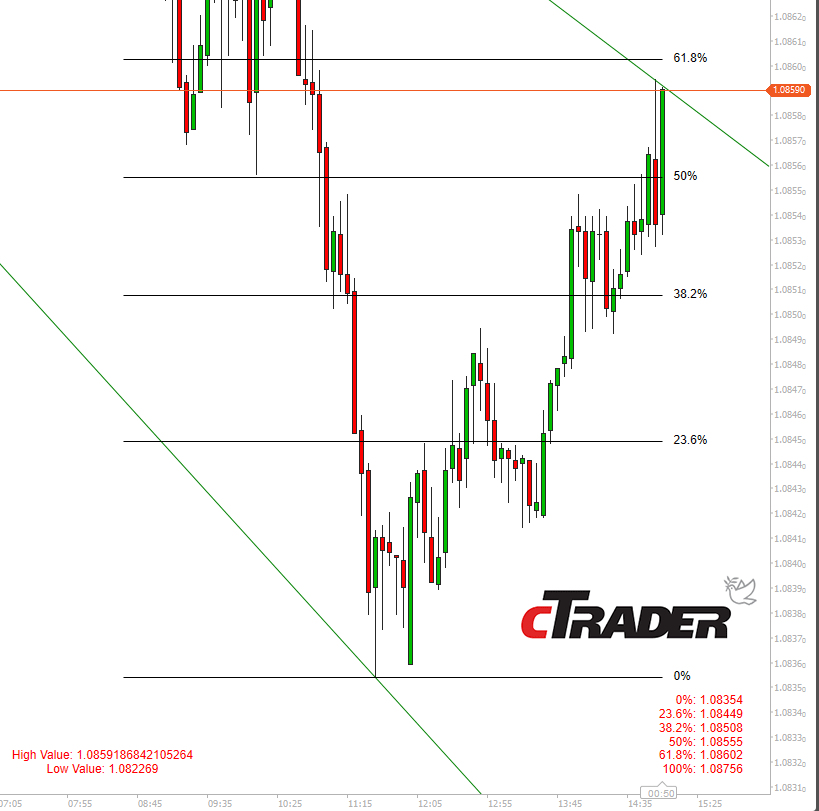
Support and resistance levels, trend lines, and Fibonacci retracement levels are technical indicators which can provide traders with zones of interest. When the price is driven towards a level marked by one of these indicators, there is an increased probability that the price will be rejected from that level. Individually, these indicators rarely provide sufficient confidence to inform trading decisions; however, by looking at them in combination and finding areas where multiple indicators converge traders can build a more confident picture of probable price action.

Support & Resistance Levels
When the market robustly rejects a price from a given level, there is a heightened likelihood that, if the market returns to that level in the future, the price will be rejected again.
E.G. An imaginary currency, ABCXYZ has sat below the 1.300 level for some time. When the price eventually climbs to this level it is likely to be viewed as a suitable zone to sell, as it is a relatively high price. Once the price breaks above 1.300, it is likely to be viewed as a suitable zone to buy, as it is a relatively low price.
How to Use S&R Levels?
The Support & Resistance component of this combined indicator scans through price history, from the most recent bar, comparing open and close prices. When it determines it has found price rejection, it marks the wick of that bar with a level.
The Look Back Period determines how far back in time the indicator should search for levels. By default, this is set to 100 bars (of the chosen time frame).
The Proximity Filter measures relative volatility (based on the average height of a bar within the chosen timeframe) and filters out any newly identified levels that fall within a zone of an existing level. This prevents the same level from being identified twice and preferentially charts more recent occurrences of a level over older occurrences. Proximity default is set to the maximum, 1, or 100% of an average bar; It can be reduced in increments of 0.1 (10%) to a minimum of 0.1. Reducing proximity will allow levels to be identified closer to each other but risks the identification of multiples of the same level.
Trend Lines
Trend lines follow the same theory as support and resistance, but rather than identifying a single, horizontal zone, they chart a predicted change in zone based on the difference between two areas of rejection.
E.G. In the following example, the black line represents observed price action, the blue line is the trend line between two points of price rejection, and the grey line represents a potential price move, predicted by the trend line.
How to Use Trend Lines?
The Trend Lines component of this combined indicator scans through price history, from the most recent bar, comparing all open prices and all closed prices independently. When it determines it has found price rejection in either series of data, it marks that point and then continues until it finds the next point. Then it draws two trend lines, one upper line for the high prices, and one lower line for the low prices.
The Look Back Period determines the initial range in which the indicator should search for rejection, and then how far back it should search beyond that. By default, the look-back period is set to 30 bars (of a chosen time frame) to capture one month (assuming the indicator is set to use the daily timeframe). Increasing look back will draw longer trendlines using older data, reducing it will only capture the most recent price action.
Fibonacci Retracement Levels
Fibonacci retracements are used to break an entire price movement into percentage brackets. The percentages used are based on the “Golden Ratio” found in the Fibonacci sequence. Retracements are drawn either from the highest high to the lowest low, or vice versa, depending on which direction the price moved. The brackets produced can then be used as support & resistance levels.
How To Use Fibonacci Retracements?
The Fibonacci Retracement component of this combined indicator scans through price history, from the most recent bar, comparing all open prices and all closed prices independently searching for the highest high and the lowest low within the data series. Depending on whether the high or the low is more recent, it then draws either a bullish or bearish retracement over the market move between the two points.
The Look Back period determines how far back the indicator should search for a high and low. By default, it is set to 100 bars (of the chosen time frame).

Summary
With an instance of the indicator loaded, a user can select a timeframe of interest and view the output overlaid on the chart. Following their chosen risk management strategy, a user can then select areas of interest where multiple confluences converge.
How To Install & Remove
First, make sure you have the cTrader trading platform installed and then simply unzip the file and double-click on it to automatically install it onto the platform.
Any Questions?
If you have any questions, please first search our product help forum for the answer, if you cannot find it, post a new question.
Need a Broker
If you are still looking for a broker you can trust, take a look at our best cTrader broker site.


