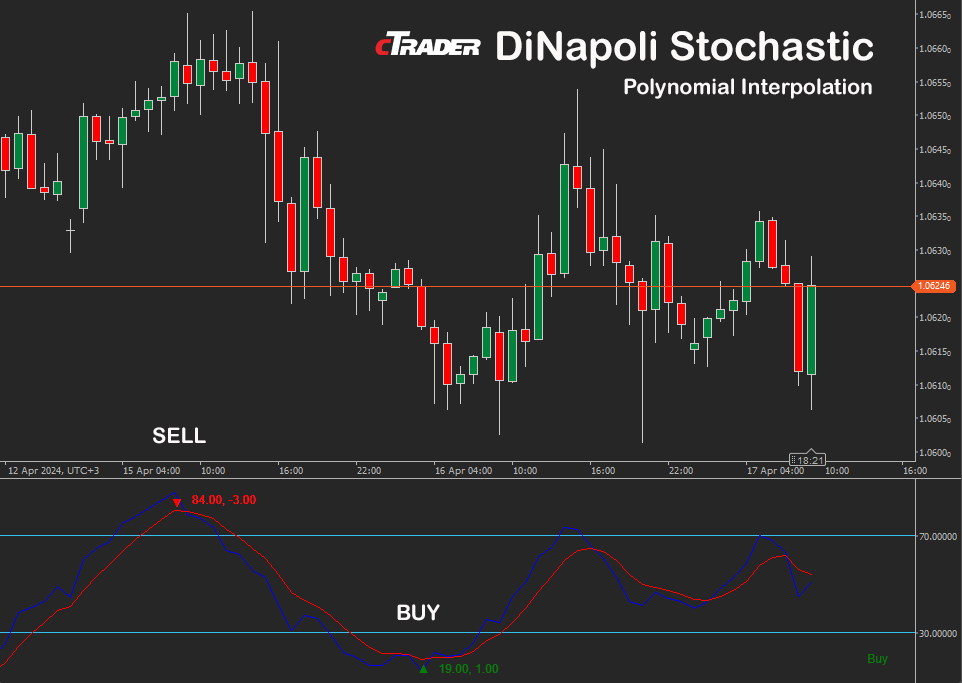
The DiNapoli Stochastic indicator is a variation of the traditional stochastic oscillator developed by trader Joe DiNapoli that is designed to provide more accurate and smoother signals compared to the original stochastic oscillator. The DiNapoli indicator is used to identify overbought and oversold conditions in the market and to generate buy and sell signals based on divergences and crossovers. It's a popular tool among technical traders for its ability to filter out market noise and provide clearer signals.
Our version of the cTrader DiNapoli Stochastic has extra logic using Polynomial Interpolation to match the curve of the lines to identify early price reversals, so you can enter or exit a trade before the markets move.
Read more about this type of indicator by Joe Dinapoli "Trading With DiNapoli Levels".
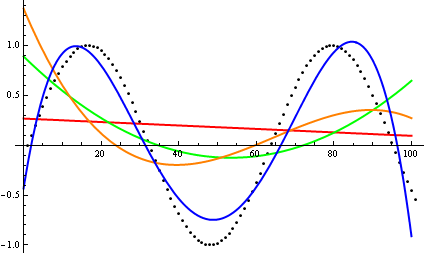
What is Polynomial Interpolation?
Polynomial interpolation is a method used in mathematics and numerical analysis to approximate a function by a polynomial. The goal is to find a polynomial function that passes through a given set of data points.
What is Curve Fitting?
Curve fitting, also known as regression analysis, is a statistical technique used to find the best-fitting curve or line that represents a set of data points, the objective is to find a mathematical function that closely matches the relationship between the independent variables.
Curve fitting is widely used in various fields, including science, engineering, economics, finance, and social sciences, to analyze and interpret data, make predictions, and understand underlying relationships.
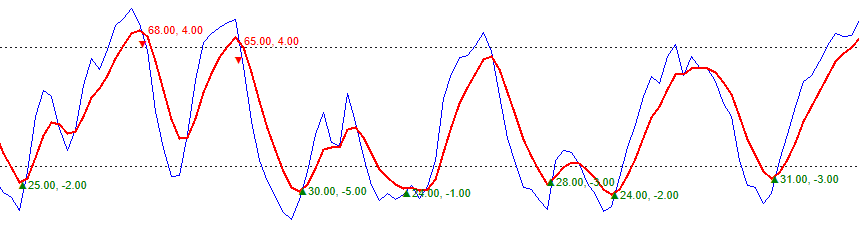
Signal Line Cross-Over Check
This involves a very simple, but useful check on the distance between the signal and result lines using the cross-over distance setting when there is indecision in the price the two lines are very close together when there is a strong change in direction the distance is higher.
Linear Regression Curve Check
This is very useful when you want to match a specific type of curve that mostly shows price reversals, it uses the Math.Net Numerics library described below for curve fitting. You can curve fit either the signal or the result line. The settings are Curve Offset and Curve Slope.
For analysis, you can use a setting called Data Analysis Mode which will show you historical curve values in the log file to help you match the values which hold the strongest weight. The video below will explain the features in more detail.
Math.NET Numerics
This assembly aims to expose algorithms and methods for numerical computations in software engineering, the areas it covers are special functions, linear algebra, probability models, random numbers, interpolation, integration, regression, optimization problems and much more.
Curve Fitting: Linear Regression & Polynomial Interpolation
Regression is all about fitting a low-order parametric model or curve data, so we can use it to make predictions on points not covered by the data. Both the data and the model are known, but we'd like to find the parameters that make the model good enough to the data according to some metric.
Curve fitting can involve either interpolation, where an exact fit to the data is required, or smoothing, in which a "smooth" function is constructed.
Data Analysis Mode
We have added a feature that will allow you to visually see the Linear Curve fitted values for the stochastic cross-over points so that you can compare this to the candle price action to help you increase the probability of a successful entry point.
Why This Indicator is Special
This indicator will allow you to define the quality of the curve which directly relates to the price action shown in the candles, by conducting historical analysis you can identify repeating price reversals and acquire the curve offset and curve slope values. Once you have these values you can enter them into the indicator so that you will only be informed of price reversals when there is a high probability, this is useful for manual trading to help make the right choice or to send signals to trade groups via telegram.
Popup Message
This is a simple popup window that is displayed on your chart when a signal is fired for a trend reversal.
Email Message
This is your standard and simple email alert, please note if you need an instant alert the moment a signal happens use the Telegram messaging service.

Telegram Alerts
When a signal occurs, the indicator will send a Telegram alert directly to your PC or mobile device, this is much faster than email as it is a push notification.
Watch a Video Demonstration
The video has been uploaded to 1080p High Quality, so do not forget to set your YouTube video quality to 1080p HD.
Duration: 14 minutes - Watch Full-Screen on YouTube
How To Install & Remove
First, make sure you have the cTrader trading platform installed, unzip the file and double-click on it to automatically install it onto the platform.
Any Questions?
If you have any questions, please first search our product help forum for the answer, if you cannot find it, post a new question.
Need a Broker
If you are still looking for a broker you can trust, look at our best cTrader broker site.


