Core Features of the Scalping Pullback Tool
This comprehensive tool provides traders with clear, actionable signals while maintaining the flexibility to adapt to various trading styles and market conditions. Its intuitive interface makes it accessible to novice and experienced traders, while its advanced features provide the depth needed for sophisticated trading strategies. These insights are essential for traders identifying reversals, breakouts, and key support or resistance zones based on the underlying order flow.
Dynamic Price Action Channel (PAC) System
- Creates a flexible trading channel using three EMAs
- Adapts automatically to market conditions
- High and low channel boundaries with center-line reference
- Default channel length: 34 periods (customizable)
Multiple EMA Trend Identification
- Fast EMA (89 periods): Short-term trend
- Medium EMA (200 periods): Intermediate trend
- Slow EMA (600 periods): Long-term trend
- Combined analysis for robust trend confirmation
Advanced Fractal Pattern Recognition
- Automatic identification of market turning points
- Top and bottom fractal patterns are marked
- Optional filtering for higher-quality signals
- Visual arrows at significant reversal points
Smart Pullback Detection
- Identifies potential reversal points
- Monitors price action relative to channel
- Confirms trend continuation opportunities
- Integrates with fractal analysis
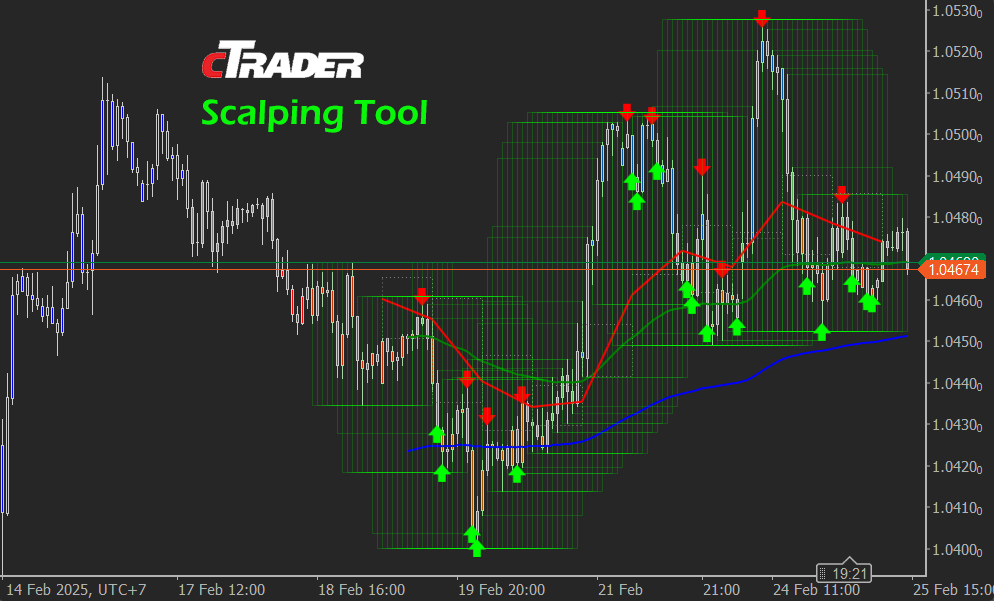
Visual Components
Display Elements
- Semi-transparent channel zones
- Up/down fractal arrows at key points
- Colour-coded price bars
- Dynamic trend background
- Buy/sell signal arrows
Colour Coding System
- Blue: Bullish conditions (above channel)
- Red: Bearish conditions (below channel)
- Gray: Neutral (within channel)
- Background colours for trend strength
Best Practices
Setup
- Apply the indicator to the preferred timeframe
- Start with default settings
- Adjust parameters based on trading style
- Save customized configurations
Trading
- Confirm signals across multiple components
- Monitor overall trend direction
- Use proper position sizing
- Follow risk management rules
- Wait for explicit signal confirmation
Performance Optimization
- Fine-tune channel length for volatility
- Adjust EMA periods for the timeframe
- Optimize fractal settings
- Test different parameter combinations
- Monitor and track results
Indicator Settings Configuration
Basic Parameters
- Channel Length (PAC High Low): Default 34
- Controls the sensitivity of the Price Action Channel
- Lower values create a tighter channel
- Higher values create a wider channel
EMA Settings
- Fast EMA Length: Default 89
- Medium EMA Length: Default 200
- Slow EMA Length: Default 600
- Toggle visibility options for each EMA
Visual Settings
- Show HH/LL: Enable/disable higher highs/lower lows markers
- Show Fractals: Display fractal patterns on the chart
- Show Only Ideal Fractals: Filter for higher-quality fractal signals
- Show Colored Bars: Enable/disable bar colouring around PAC
- Show Buy/Sell Alerts: Toggle trade signal indicators
- Show Trend Background Color: Enable/disable trend visualization
Advanced Options
- Pullback Period: Default 3 periods
- Adjusts the lookback period for pullback confirmation
- Show Signals on Closed Candles Only: Delay signals for confirmation
- Use Heikin Ashi Candles: Toggle between regular and Heikin Ashi
- Historical Bars: Control the number of bars displayed
Trading Signals
Buy Signals
- Price crosses above PAC with pullback
- Fast EMA above Medium EMA
- Fractal confirmation, if enabled
- A green arrow appears below the price
Sell Signals
- Price crosses below PAC with pullback
- Fast EMA below Medium EMA
- Fractal confirmation, if enabled
- A red arrow appears above the price
Common Issues
Indicator Not Showing
- Check indicator attachment
- Verify parameter settings
- Refresh chart
Signal Quality
- Adjust channel length
- Modify pullback period
- Enable/disable filters
Maintenance
- Regularly update the indicator version
- Clear chart periodically
- Monitor performance
- Adjust settings as needed
How To Install & Remove
First, make sure you have the cTrader trading platform installed. Then, unzip the file and double-click it to install it automatically.
Any Questions?
If you have any questions, please first search our product help forum for the answer; if you cannot find it, post a new question.
Need a Broker
If you are still looking for a trustworthy broker, look at our best cTrader broker site.


