Indicator Overview
This indicator calculates volatility from log returns and then denoises it using a Haar wavelet transform. The result is a raw volatility line and a wavelet-smoothed version, both of which adapt to scaling so they remain readable on any timeframe or instrument. Low-volatility regimes are highlighted with a green histogram mask that only appears when conditions are active, keeping the chart uncluttered.
Background & History
Wavelet transforms were first developed in signal processing and mathematics as a way to compress and filter data while retaining key features. In finance, wavelets have been applied to remove noise from returns and improve volatility estimates. This indicator adapts that research into a practical tool for traders, combining traditional volatility estimation with wavelet denoising and adding an intuitive chart display.
How the Indicator Works
The Wavelet-Based Volatility Filter looks at how much prices move from bar to bar and then smooths out the noisy jumps. It does this in two steps:
-
First, it measures raw volatility using the standard deviation of log returns.
-
Then it runs the same returns through a wavelet filter (a smart noise remover) to get a cleaner volatility line.
Next, it compares the filtered volatility to a baseline (which can be an EMA, SMA, or rolling median).
-
If volatility drops below the baseline by a chosen amount, the indicator marks the chart with a green histogram.
-
This makes low-volatility “quiet” phases stand out without cluttering the chart.
To maintain readability, the indicator automatically rescales the values so that lines don’t appear flat, regardless of the symbol or timeframe used.
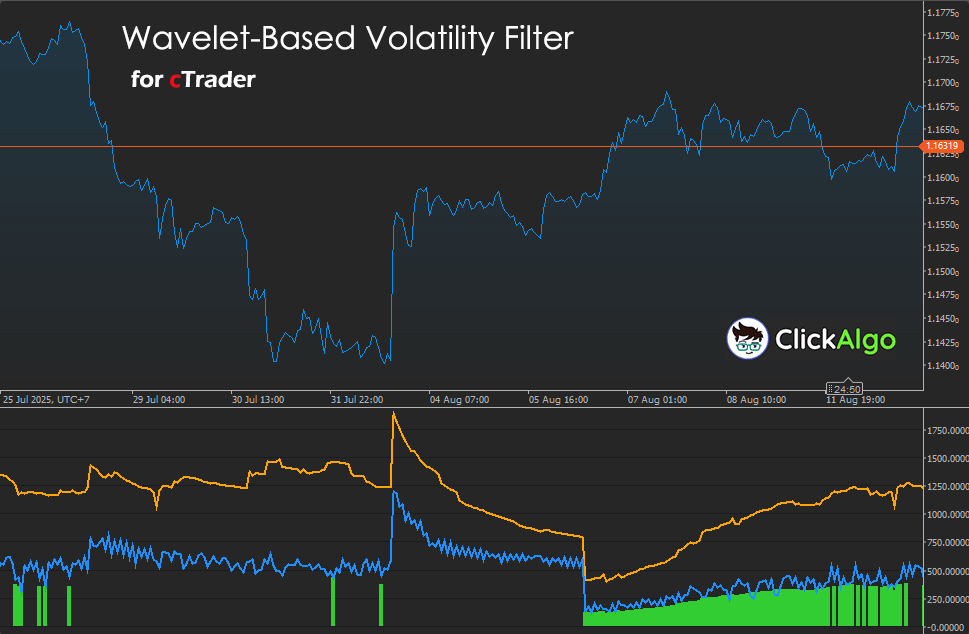
In practice, the orange line represents the raw volatility, the blue line represents the cleaned version, and the green bars appear only when the market is unusually quiet.
Key Features
The Wavelet-Based Volatility Filter provides traders with a more informed approach to identifying when the market is calm or volatile. Instead of showing just one noisy volatility line, it provides both the raw data and a cleaner, filtered version.
-
Two Volatility Views. The orange line represents raw volatility, while the blue line displays a wavelet-smoothed version that filters out noise and provides a clearer signal.
-
Low-Volatility Mask. A green histogram automatically appears only when volatility falls below a chosen threshold, helping you spot quiet regimes that often lead to sharp moves.
-
Baseline Options. Choose how the indicator decides “normal” volatility, using an exponential moving average (EMA), a simple moving average (SMA), or a rolling median for stability.
-
Adaptive Scaling. Values are automatically rescaled to prevent them from flattening out on different symbols or timeframes, ensuring the display remains readable.
-
Flexible Thresholding. Select between universal auto-thresholding or a manual setting, with soft or hard cut-offs depending on how sharp you want the filter to be.
-
Clean Visuals. The histogram only shows when conditions are met, meaning your chart stays clear and easy to read.
-
Customisable Mask. Choose whether the mask adjusts automatically to match the chart scale or stays at a fixed height for consistency.
-
Safety Checks. Built-in guards ensure the indicator only runs after enough data has loaded, avoiding misleading early values.
How to Use it for Trading (at a glance)
The Wavelet-Based Volatility Filter is designed to help you spot when markets are entering or leaving quiet phases. These low-volatility regimes often come before sharp expansions, making them valuable for timing entries or managing risk.
-
Breakout Trading. When the green histogram appears, it marks a period of suppressed volatility. Many traders prepare for breakouts here, since quiet markets often lead to strong directional moves once volatility expands again.
-
Trend Filters. Use the blue wavelet-smoothed volatility line to confirm if a market move has real momentum or is just short-term noise. Low volatility during a trending phase can mean the move is stable and less risky.
-
Risk Management. Quiet periods can help you size down or hold back on entries if your strategy requires active conditions. Conversely, when volatility rises above baseline, it can be a signal to widen stops or reduce exposure.
-
Avoiding Whipsaws. By only trading when volatility is expanding, you can avoid getting caught in sideways ranges where signals are unreliable.
-
Multi-Indicator Setups. The filter works well when combined with momentum indicators, moving averages, or breakout systems. For example, waiting for a green histogram to end before entering a moving average cross can reduce false starts.
In short, use the green histogram as your “quiet market alert” and the volatility lines as confirmation of when the market is heating up again.
Inputs & Parameters
The indicator encompasses a broad range of user inputs that can be adjusted for various instruments and timeframes. The table below provides a detailed explanation of each parameter.
| Parameter |
Default / Type |
Description |
| Volatility |
| Vol Window |
64 (int) |
Lookback window for volatility calculation. |
| Baseline Type |
EMA / SMA / Median |
Method used for baseline volatility. |
| Baseline Period |
64 (int) |
Period for baseline calculation. |
| Filter Trigger (ratio) |
0.9 (double) |
Threshold ratio to trigger the low-volatility mask. |
| Wavelet |
| Wavelet Levels |
3 (int) |
Number of Haar wavelet decomposition levels. |
| Threshold Mode |
Universal / Manual |
Sets the threshold calculation method. |
| Threshold Type |
Hard / Soft |
Defines how thresholding is applied. |
| Manual Threshold |
0.001 (double) |
Threshold value when Manual mode is selected. |
| Threshold Scale |
0.8 (double) |
Scales the calculated threshold. |
| Visual |
| Mask Height % (Auto) |
0.30 (double) |
Relative height of the histogram mask. |
| Normalise To Baseline |
true (bool) |
Normalises outputs relative to baseline volatility. |
| Scale Multiplier |
500.0 (double) |
Multiplier applied to displayed values. |
| Auto Scale |
true (bool) |
Automatically scales when not normalised. |
| Auto Scale Target |
1000.0 (double) |
Target value for auto-scaling. |
| Show Filter Mask |
true (bool) |
Enables or disables the histogram mask. |
| Mask Amplitude Mode |
Auto / Fixed |
Chooses automatic or fixed mask amplitude. |
| Mask Amplitude (Fixed) |
1.0 (double) |
Fixed mask amplitude when selected. |
| Safety |
| Minimum Bars |
128 (int) |
Minimum number of bars required before calculation. |
Formula
The indicator measures volatility from log returns, denoises those returns using a Haar wavelet, then compares the filtered volatility to a baseline to flag quiet regimes. Equations and thresholds are shown below.
Pipeline: Prices → Log returns → Haar forward transform → Threshold details → Haar inverse → Filtered returns → Volatility → Baseline comparison.
Log Returns. rt = ln( max( Pt, ε ) ) − ln( max( Pt−1, ε ) ).
Raw Volatility, sample standard deviation over N bars. μ = (1 / N) Σi=1N ri, σraw = √{ (1 / (N − 1)) Σi=1N ( ri − μ )2 }.
Haar Wavelet Decomposition, one level, repeated across levels. ai = ( x2i + x2i+1 ) / √2, di = ( x2i − x2i+1 ) / √2.
Detail Thresholding. Hard: d'i = di if |di| ≥ τ, else 0. Soft: d'i = sign(di) · max( |di| − τ, 0 ).
Universal Threshold, auto mode, using finest scale details. &hat;σ = MAD / 0.6745, τ = &hat;σ · √( 2 ln N ).
Filtered Volatility, after inverse transform. μ* = (1 / N) Σi=1N ri*, σwav = √{ (1 / (N − 1)) Σi=1N ( ri* − μ* )2 }.
Baseline. baseline = EMA( σwav ) or SMA( σwav ) or rolling median of σwav over the Baseline Period.
Normalised Display, optional. vdisp = ( v / baseline ) · ScaleMultiplier.
Auto Scale when not normalised. chosenScale = clamp( AutoScaleTarget / baseline, 10, 1×10⁸ ), vdisp = v · chosenScale.
Regime Ratio and Mask Condition. ρ = σwav / baseline, Low volatility if ρ ≤ θ , Filter Trigger.
Mask Amplitude. Auto: A = max( |rawdisp|, |wavdisp| ) · p, Fixed: A = Afixed.
| Symbol |
Meaning |
| Pt |
Close price at time t. |
| ε |
Tiny floor to avoid log of zero, for example 1e−12. |
| rt |
Log return at time t. |
| N |
Window length for volatility calculation. |
| μ, μ* |
Mean of raw returns, mean of filtered returns. |
| σraw, σwav |
Raw volatility, wavelet filtered volatility. |
| MAD |
Median absolute deviation of finest scale details. |
| τ |
Threshold used to shrink detail coefficients. |
| ρ |
Regime ratio, filtered volatility divided by baseline. |
| θ |
Filter Trigger ratio for low volatility conditions. |
| p |
Mask Height percent, Mask Height %. |
| chosenScale |
Auto scale factor when not normalised. |
Notes: Returns are padded by symmetric reflection to the next power of two length before the Haar transform. Thresholding is applied to the detail coefficients at every level, then the series is reconstructed using the inverse Haar transform.
Advantages
The Wavelet Based Volatility Filter gives traders a much cleaner and more adaptive view of market conditions compared to traditional volatility tools. By applying wavelet denoising, the indicator removes random noise while still preserving important shifts in volatility, making it easier to distinguish between genuine quiet periods and short-lived fluctuations. The automatic scaling ensures that the plots remain visible across different symbols and timeframes, while the low-volatility mask highlights quiet regimes without cluttering the chart. Together, these features make it highly practical for breakout traders, risk managers, and anyone looking for a clearer read on market activity.
Disadvantages
The main drawback of this indicator is its complexity. While it provides a sophisticated and more refined view of volatility, it may be difficult for beginners to fully understand or configure the settings effectively. Because it relies on multiple parameters — such as wavelet levels, baseline types, and threshold modes — poor tuning can lead to misleading signals or overfitting to past data. It is also more computationally demanding than simpler volatility measures like ATR or standard deviation, which may affect performance if applied to many charts at once. For traders who prefer straightforward indicators, the additional options may feel overwhelming.
How To Install & Remove
First, ensure that you have the cTrader trading platform installed. Then, unzip the file and double-click it to automatically install the platform.
Need Extra Help?
Get instant answers with cTrader Sensei — our free AI assistant built for the cTrader platform. It can explain the indicator settings, suggest trading strategies, and guide you step-by-step through the use of this indicator. Rated 4.9 out of 5 in the ChatGPT Store.
Chat with cTrader Sensei
Prefer human help? Visit our support forum where our team and community can assist you.
Note: cTrader Sensei runs on OpenAI's ChatGPT platform. To use it, you will be asked to create a free OpenAI account. Registration is quick and costs nothing.
The free version works immediately, but upgrading to a ChatGPT Plus subscription unlocks the latest GPT model, which provides more accurate and detailed answers for trading, coding, and product support.
Need a Broker
If you're still looking for a broker with tight spreads and fast execution, visit our top cTrader broker site.


