Indicator Overview
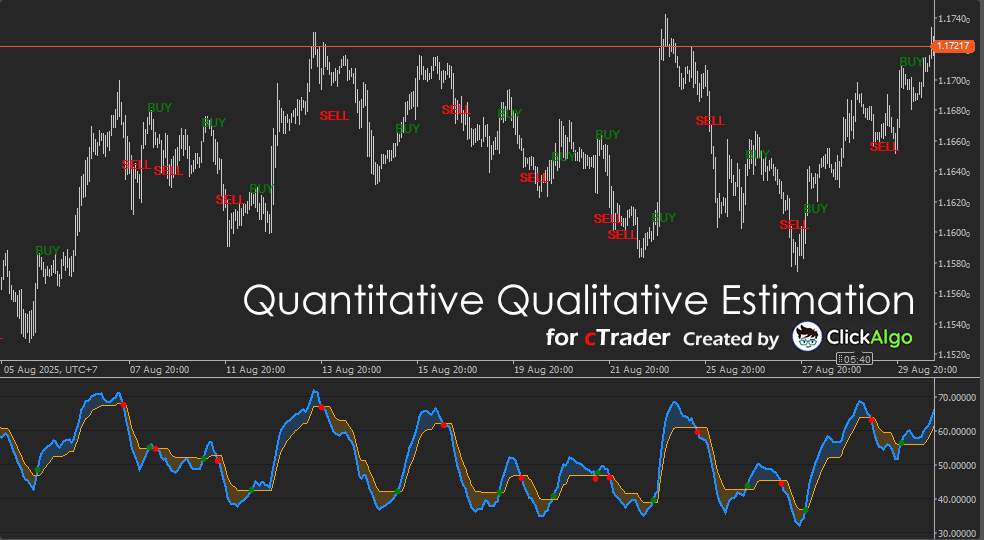
The QQE indicator enhances the traditional RSI by smoothing its values and applying adaptive trailing bands. These bands expand and contract in response to market volatility, while crossover points between the smoothed RSI and the bands generate trading signals. On the chart, traders see a clean line for smoothed RSI, an orange trailing band, and optional buy/sell markers where momentum shifts occur.
Background & History
The QQE was developed as an evolution of RSI, aiming to address its sensitivity to short-term price movements. While RSI is valuable, it can be prone to false signals in choppy markets. QQE improves this by introducing smoothing techniques and volatility-based trailing bands. Over time, this method has gained popularity among traders for its ability to filter noise and provide clearer momentum cues.
How the Indicator Works
The QQE starts with RSI values and applies smoothing to reduce noise. It then measures the average true range of RSI changes to estimate volatility. Using this, it creates adaptive trailing bands.
-
When the smoothed RSI rises above the trailing band, a bullish condition is signalled, and a buy marker may be displayed.
-
When the smoothed RSI falls below the trailing band, a bearish condition is signalled, and a sell marker may appear.
-
The bands act like a dynamic support/resistance level around RSI, tightening in low volatility and widening in high volatility.
On the chart, you’ll see a blue line (smoothed RSI), an orange line (trailing band), and optional text signals (BUY or SELL) placed near bars when crossovers happen.
Key Features
The cTrader QQE indicator is built for clarity and adaptability. It improves RSI readings and adds direct trade signals.
-
Smoothed RSI line reduces noise and false swings.
-
The adaptive trailing band adjusts according to volatility for improved accuracy.
-
Clear BUY and SELL markers on the chart.
-
Cloud shading between RSI and the band highlights bullish or bearish zones.
-
Fully customizable colours, offsets, and visibility options.
How to Use it for Trading (at a glance)
The QQE is a momentum-based indicator and can be applied in several practical ways.
-
Look for a BUY signal when the smoothed RSI crosses above the trailing band. This suggests a strengthening momentum and potential continuation of the upward trend.
-
Look for a SELL signal when the smoothed RSI crosses below the trailing band. This signals weakening momentum and possible downward pressure.
-
Use the shaded cloud zones as confirmation: when the RSI remains above the band, conditions are generally bullish, and when below, conditions lean bearish.
-
Combine QQE with a higher timeframe trend indicator (like moving averages) to filter signals. For example, only take BUY signals when the overall trend is up.
-
Manage risk by setting stop-losses just beyond recent highs or lows, and consider using trailing stops to lock in profits when momentum continues.
-
Beginners can start by applying QQE to demo charts, focusing on identifying crossovers and checking how well signals align with market moves.
Inputs & Parameters
This indicator features adjustable settings, allowing traders to fine-tune its sensitivity and signal display.
| Parameter |
Default/Type |
Description |
| RSI Period |
14 |
Number of bars used to calculate the base RSI. |
| Smoothing Period |
5 |
Length used to smooth RSI values, reducing noise. |
| Band Multiplier |
4.236 |
Multiplier applied to volatility estimate to create trailing bands. |
| Show Signals |
True/False |
Toggles display of BUY and SELL markers on the chart. |
| Buy Text Colour |
Green |
Colour for BUY text signals. |
| Sell Text Colour |
Red |
Colour for SELL text signals. |
| Text Bar Offset |
-3 |
Moves the text markers forward or backwards on the chart. |
| Text Pip Offset |
10 |
Vertical offset in pips for positioning text above or below candles. |
Formula
The QQE is constructed from the RSI, incorporating smoothing and volatility-based trailing bands. The simplified formula is:
Pipeline: Price series → Compute RSI → Apply smoothing → Measure RSI volatility (Δ and ATR) → Build trailing band with multiplier → Detect crossovers for BUY and SELL signals.
RSI Calculation. RSIt = Relative Strength Index of closing prices over N periods.
Smoothing. SmoothedRSIt = SmoothedRSIt−1 + (1 / SmoothPeriod) × (RSIt − SmoothedRSIt−1).
Volatility Estimate. Δt = |SmoothedRSIt − SmoothedRSIt−1|. ATRRSI,t = ATRRSI,t−1 + (1 / RsiPeriod) × (Δt − ATRRSI,t−1).
Band Range. BandRanget = ATRRSI,t × BandMultiplier.
Trailing Band Update. If SmoothedRSIt > Bandt−1, set Bandt = max(Bandt−1, SmoothedRSIt − BandRanget). Otherwise, Bandt = min(Bandt−1, SmoothedRSIt + BandRanget).
Signal Condition. BUY when SmoothedRSI crosses above Band. SELL when SmoothedRSI crosses below Band.
| Symbol |
Meaning |
| RSIt |
Relative Strength Index of closing prices at bar t over N periods. |
| SmoothedRSIt |
Exponentially smoothed RSI value at bar t. |
| Δt |
Absolute change between consecutive smoothed RSI values. |
| ATRRSI,t |
Smoothed volatility estimate of RSI changes. |
| BandRanget |
Volatility band width = ATRRSI,t × BandMultiplier. |
| Bandt |
Adaptive trailing band updated each bar. |
| Buy / Sell Signal |
Generated when SmoothedRSI crosses above (buy) or below (sell) the band. |
| N |
RSI calculation period. |
| SmoothPeriod |
Length used for RSI smoothing. |
| BandMultiplier |
Volatility scaling factor for bandwidth. |
Advantages
The QQE reduces noise compared to raw RSI, making signals clearer and more reliable. It adapts to changing volatility, ensuring bands reflect real market conditions. Traders benefit from simple, visual BUY/SELL signals without sacrificing the depth of momentum analysis.
Disadvantages
Like all technical indicators, QQE is not foolproof. In sideways or low volatility markets, it may produce false signals. It should not be used in isolation but combined with trend filters, price action, or additional risk management tools.
How To Install & Remove
First, ensure that you have the cTrader trading platform installed. Then, unzip the file and double-click it to automatically install the platform.
Need Extra Help?
Get instant answers with cTrader Sensei — our free AI assistant built for the cTrader platform. It can explain the indicator settings, suggest trading strategies, and guide you step-by-step through the use of this indicator. Rated 4.9 out of 5 in the ChatGPT Store.
Chat with cTrader Sensei
Prefer human help? Visit our support forum where our team and community can assist you.
Note: cTrader Sensei runs on OpenAI's ChatGPT platform. To use it, you will be asked to create a free OpenAI account. Registration is quick and costs nothing.
The free version works immediately, but upgrading to a ChatGPT Plus subscription unlocks the latest GPT model, which provides more accurate and detailed answers for trading, coding, and product support.


